
uRADMonitor – Online remote radiation monitoring station
radhoo, Mon Mar 21 2011, 12:08PM______Version 3.3 Sept 02 - Oct 20, 2012__________________________________________________ ________________
uRADMonitor is a network connected monitoring station, focused on continuous Environmental Radiation Surveillance. This capability is delivered by a digital dosimeter constructed around the highly sensitive Geiger Muller tube SBM-19. Additional sensors gather real time data on temperature , humidity and sky luminosity.
The device is located in Timisoara, Romania.
Construction details (this is version 3.3) and a few words on Geiger tubes and radiation detection can be found in the messages below or in this article.
Graphs built in real time with uRADMonitor data. Time is GMT+2 (Europe/Timisoara):
Radiation (CPM):

Temperature (Celsius):

Humidity (RH):

Luminosity (RL):

Charts are built with the last 7 days data, integrated at a 2 hours interval. Size is xlarge (maximum).
See how to change the parameters:

The hardware
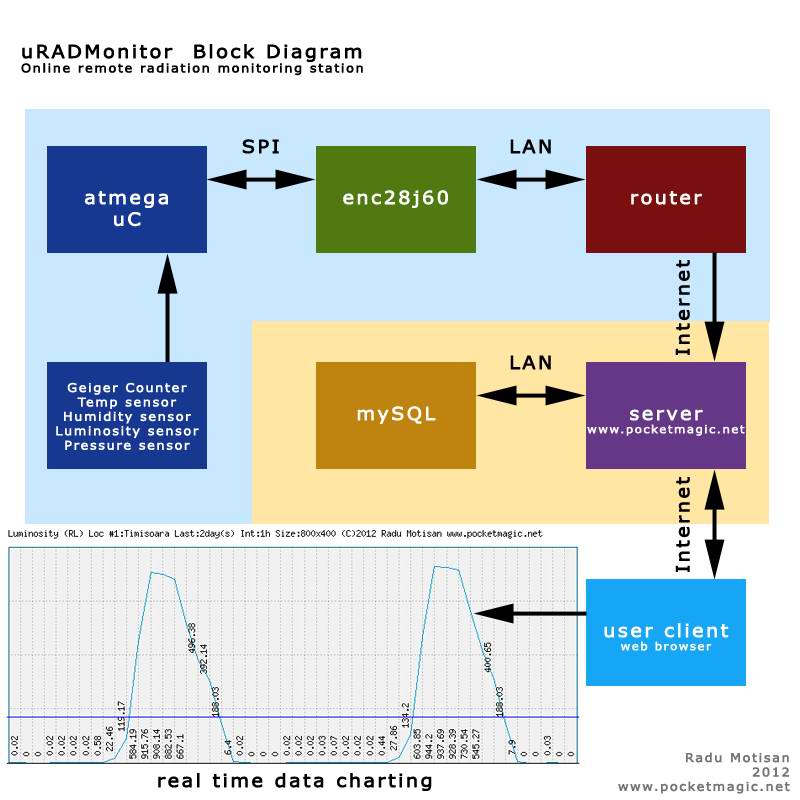
Several sensors, including a Geiger counter, are connected to a microcontroller (Atmega168). A network interface chip (enc28j60) provides an Ethernet interface. Data from sensors is collected on a one minute interval and exported online to the server (pocketmagic.net). Using PHP and SQL, the data is stored and post processed, so users connecting via a webbrowser can access various charts, in real time:
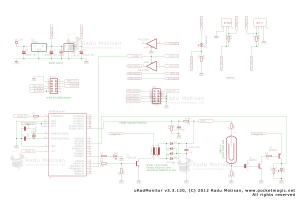
Circuit diagram:
Re: uRADMonitor – Online remote radiation monitoring station
Proud Mary, Mon Mar 21 2011, 01:11PM
SI-22 is definitely one of the best CCCP gamma tubes - a very good choice, I'd say.
It has enough gas volume to make a good quality instrument.
Proud Mary, Mon Mar 21 2011, 01:11PM
SI-22 is definitely one of the best CCCP gamma tubes - a very good choice, I'd say.

It has enough gas volume to make a good quality instrument.
Re: uRADMonitor – Online remote radiation monitoring station
radhoo, Sun Mar 27 2011, 02:12PM
[moved]
radhoo, Sun Mar 27 2011, 02:12PM
[moved]
Re: uRADMonitor – Online remote radiation monitoring station
radhoo, Sun Jan 08 2012, 05:37PM
[moved]
radhoo, Sun Jan 08 2012, 05:37PM
[moved]
Re: uRADMonitor – Online remote radiation monitoring station
Proud Mary, Sun Jan 08 2012, 09:36PM
I see what you mean about the pancake detector. Generally, I would only expect the tube to light up like that with excessive anode voltage.
If this is the device with three elements, I suggest you connect the grid to a variable negative supply - say 0-100V - and increase the negative voltage until the continuous conduction is just extinguished, so light is only emitted at particle strikes.
This kind of continuous conduction is very damaging to GM tubes, so it would be best not to use it until you have the problem sorted out, or the tube may be ruined.
Re: uRADMonitor – Online remote radiation monitoring station
radhoo, Mon Jan 09 2012, 10:13AM
[moved]
radhoo, Mon Jan 09 2012, 10:13AM
[moved]
Re: uRADMonitor – Online remote radiation monitoring station
Proud Mary, Mon Jan 09 2012, 11:35AM
I have seen a fault which was the exact opposite of what you describe, where a tube connection had failed, effectively placing the tube in series with a small capacitance. At first, when the 'capacitor' had no charge upon it, the tube would behave as normal, but in short time, the 'capacitor' would become fully charged, so the voltage across the anode and cathode of the tube fell below the threshold voltage of the tube, which would no longer work at all after a few seconds.
In your case, it is possible that the Br quenching gas has reacted with an electrode to produce the metallic corrosion you describe, and so is no longer available to quench.
Thoughts added after lunch...
I think I have this thing sorted now.
Connect the cathode to Earth/HV- via a resistor of 1MΩ - this will cause a voltage drop of 10V when 10μA is flowing through the tube.
Connect the grid to Earth/HV- via a resistor 220kΩ - 470kΩ.
This configuration will set a nominal voltage of 10V negative on the grid when 10μA is flowing through the tube.
If this auto-bias circuit works, then you can adjust the size of the cathode resistor for best results. A 1MΩ variable resistor would enable you to vary the grid voltage from ~0 - 10V - depending on the actual current flowing through the tube in multiple Townsend avalanche conditions.
Proud Mary, Mon Jan 09 2012, 11:35AM
radhoo wrote ...
The last frames (beyond 3:47) are pictures added to the video, and they where recorded using very loooong exposures, to join all those tiny little neon discharges into the strong glow we see.
So it's not as bad as it looks, but
- at first the SI14G works as expected, and is very sensitive to any of my test source (including weak uranium glass)
- then gradually, even with the test source removed, the number of counts rises, until it reaches an impossible level, a point where I shut down the HV, to prevent any further damaging
- it appears this uncontrolled avalanche happens in a given region of the SI14g, where the electrodes also seem corroded by looking with the naked eye (probably over-voltage stress, or old tube)
Thanks for the advise with using the third electrode to temper down the uncontrolled discharges. It might help improving the tube's stability. I also tried lower voltages, bigger resistors, but didn't help.
Proud Mary wrote ...
I see what you mean about the pancake detector. Generally, I would only expect the tube to light up like that with excessive anode voltage.
If this is the device with three elements, I suggest you connect the grid to a variable negative supply - say 0-100V - and increase the negative voltage until the continuous conduction is just extinguished, so light is only emitted at particle strikes.
This kind of continuous conduction is very damaging to GM tubes, so it would be best not to use it until you have the problem sorted out, or the tube may be ruined.
Sorry for the confusion, please take only the video part showing the SI14G as a reference (recorded with lights on, 3:23 - 3:47).I see what you mean about the pancake detector. Generally, I would only expect the tube to light up like that with excessive anode voltage.
If this is the device with three elements, I suggest you connect the grid to a variable negative supply - say 0-100V - and increase the negative voltage until the continuous conduction is just extinguished, so light is only emitted at particle strikes.
This kind of continuous conduction is very damaging to GM tubes, so it would be best not to use it until you have the problem sorted out, or the tube may be ruined.
The last frames (beyond 3:47) are pictures added to the video, and they where recorded using very loooong exposures, to join all those tiny little neon discharges into the strong glow we see.
So it's not as bad as it looks, but
- at first the SI14G works as expected, and is very sensitive to any of my test source (including weak uranium glass)
- then gradually, even with the test source removed, the number of counts rises, until it reaches an impossible level, a point where I shut down the HV, to prevent any further damaging
- it appears this uncontrolled avalanche happens in a given region of the SI14g, where the electrodes also seem corroded by looking with the naked eye (probably over-voltage stress, or old tube)
Thanks for the advise with using the third electrode to temper down the uncontrolled discharges. It might help improving the tube's stability. I also tried lower voltages, bigger resistors, but didn't help.
I have seen a fault which was the exact opposite of what you describe, where a tube connection had failed, effectively placing the tube in series with a small capacitance. At first, when the 'capacitor' had no charge upon it, the tube would behave as normal, but in short time, the 'capacitor' would become fully charged, so the voltage across the anode and cathode of the tube fell below the threshold voltage of the tube, which would no longer work at all after a few seconds.
In your case, it is possible that the Br quenching gas has reacted with an electrode to produce the metallic corrosion you describe, and so is no longer available to quench.
Thoughts added after lunch...
I think I have this thing sorted now.
Connect the cathode to Earth/HV- via a resistor of 1MΩ - this will cause a voltage drop of 10V when 10μA is flowing through the tube.
Connect the grid to Earth/HV- via a resistor 220kΩ - 470kΩ.
This configuration will set a nominal voltage of 10V negative on the grid when 10μA is flowing through the tube.
If this auto-bias circuit works, then you can adjust the size of the cathode resistor for best results. A 1MΩ variable resistor would enable you to vary the grid voltage from ~0 - 10V - depending on the actual current flowing through the tube in multiple Townsend avalanche conditions.
Re: uRADMonitor – Online remote radiation monitoring station
Tetris, Mon Jan 09 2012, 10:18PM
The circuit itself seems simple enough to build, that even I, with very little knowledge in circuits, could build it. But where in Orlando could I get a geiger tube? It's not like they are lying around or readily available at the electronics hobby store "Skycraft.." or are they? Can I pull one out of something? I mean... not that I could use a geiger counter for anything useful in orlando... I don't know where a nuclear one is near by that I could mess with the geiger counter. But then again, today in french class I was wondering how that water bottling company Evian is naive spelled backwards, and maybe we are easily being fooled to think that it is spring water while it is really water from the nuclear power plants there. Course I was joking up till when my teacher said 80% of their power is from nuclear and now I will never buy evian again. So I'd detect the amounts in it, and if it is more than jackfruit nuts or something, i'll never buy it again. How sensitive is that counter?
Re: uRADMonitor – Online remote radiation monitoring station
radhoo, Wed Jan 11 2012, 11:27AM
It's not good for what you need since it doesn't show an estimation on the quantity of radioactive material detected (uC) nor a radiation dose. You could still use it for relative comparisons (one rock is more radioactive than other, because the led blinks more, etc).
For me is just a test build to understand Geiger tubes better including testing various other tubes, and then move forward to more advanced detectors. I do not plan to use it for any other purpose.
But indeed, the project was simple and fun to make. Geiger tubes you can get online, Russian and Ukrainian sellers have some on ebay.
Re: uRADMonitor – Online remote radiation monitoring station
radhoo, Wed Jan 11 2012, 11:34AM
Do you perhaps have any resources available on the damage GM tubes suffer in time. They all seem to have a "Max number of clicks" life-time parameter in their specs.
Not very important, though.
 (sorry for the blurry pic)
radhoo, Wed Jan 11 2012, 11:34AM
Proud Mary wrote ...
In your case, it is possible that the Br quenching gas has reacted with an electrode to produce the metallic corrosion you describe, and so is no longer available to quench.
I do have a nice small G15H tube made by I.F.A. , unfortunately it is at the end of its life. These tubes where all painted black, so I can't see the electrodes. H in the end stands for Halogen, it might have provided a clue on how the electrodes look after a long use.In your case, it is possible that the Br quenching gas has reacted with an electrode to produce the metallic corrosion you describe, and so is no longer available to quench.
Do you perhaps have any resources available on the damage GM tubes suffer in time. They all seem to have a "Max number of clicks" life-time parameter in their specs.
Not very important, though.
Proud Mary wrote ...
I think I have this thing sorted now.
Connect the cathode to Earth/HV- via a resistor of 1MΩ - this will cause a voltage drop of 10V when 10μA is flowing through the tube.
Connect the grid to Earth/HV- via a resistor 220kΩ - 470kΩ.
This configuration will set a nominal voltage of 10V negative on the grid when 10μA is flowing through the tube.
If this auto-bias circuit works, then you can adjust the size of the cathode resistor for best results. A 1MΩ variable resistor would enable you to vary the grid voltage from ~0 - 10V - depending on the actual current flowing through the tube in multiple Townsend avalanche conditions.
This might work if the grid is placed between the anode and the cathode. I will try to visually inspect the geometry and put some drawings here. The datasheet shows the grid in a remote location, and my long-exposure pictures show only the center part of the tube being illuminated, showing that the third electrode/grid (unused in my setup) would be placed towards the exterior: I think I have this thing sorted now.
Connect the cathode to Earth/HV- via a resistor of 1MΩ - this will cause a voltage drop of 10V when 10μA is flowing through the tube.
Connect the grid to Earth/HV- via a resistor 220kΩ - 470kΩ.
This configuration will set a nominal voltage of 10V negative on the grid when 10μA is flowing through the tube.
If this auto-bias circuit works, then you can adjust the size of the cathode resistor for best results. A 1MΩ variable resistor would enable you to vary the grid voltage from ~0 - 10V - depending on the actual current flowing through the tube in multiple Townsend avalanche conditions.
 (sorry for the blurry pic)
Re: uRADMonitor – Online remote radiation monitoring station
Proud Mary, Wed Jan 11 2012, 01:27PM
I'm sorry to hear about your G21H tube. I thought it looked a very nice one.
Now, as to the service life of GM tubes.
1) Life expectancy expressed as total counts:
(a) the obsolete (1940s) argon-ethanol GM tubes had a short service life, because some of the ethanol quench gas was used up with every avalanche, and was not replaced. So we will assume our talk is about halogen tubes only.
(b) in amateur use, where our strongest sources are likely to be natural uranium radiominerals such as pitchblende (< 100μGy/hr at 30mm distance) the manufacturer's total counts lifetime will never be reached.
2) Life expectancy in the Time domain.
(A) structural failure including:
(i) seal failure in mica window tubes - something quite common in older devices. This may not be visible to the naked eye.
(ii) porosity in glass metal seals.
(iii) slow chemical attack on metal elements by halogen gases due to poor design choice of metals.
(B) Growing quietly old, carefully stored in the dark e.g. in an unopened box. In my experience, there is a very good chance that a tube that has never been used and is still in an unopened box will still perform in accordance with its data sheet written 50 years earlier. I have tested many GM tubes from the 1950s and 1960s, and not yet found a bad one among tubes still in their original boxes with their original paperwork. There will be some bad ones, no doubt, but not very many*.
Avoid buying tubes from experimenters who may have cruelly abused them. For example, the properties of a tube run for any length of time at excess voltage (i.e. above the Geiger–Müller region of the slope) may have been permanently changed.
Lastly, if you remove the opaque coating from a glass GM tube to see what is inside, be sure to repaint it before using the tube anywhere where light can get at it. The opaque coating is there to block UV photons, which can and will cause ionisation events in the gas - usually seen as spotty, erratic counting.
* "The shelf life of Geiger–Müller tubes, when out of commission or when installed in equipment that is itself out of commission, is extremely long." - Centronic's Geiger–Müller Tube Theory see:

Re: uRADMonitor – Online remote radiation monitoring station
radhoo, Wed Jan 11 2012, 05:51PM
Thank you. Indeed the Centronic paper on GM tubes was a very good read, I had to print it so I could underline important paragraphs with the pencil.
I do have a G21H as well and it is in perfect shape (NOS) , the tubes that is damaged and I mentioned before is G15H . I got it from the atomic institute directly, so it was only used in adequate equipment. It's the small sized type not more than 10cm in length, so was probably used with stronger sources.
It doesn't show in the video above.
Re: uRADMonitor – Online remote radiation monitoring station
Proud Mary, Wed Jan 11 2012, 07:28PM
An atomic institute could probably reach the maximum count life of G15H very quickly indeed!
Don't let the grid of G15H float, or it will collect an unwanted charge. As a quick experiment, you could connect the grid directly to the cathode and see what happens.
If you are sure you have connected it up correctly, then I would spend no more time and money on it. Save the mica for something else. (I have used the mica sheets which you can buy new on ebay as windows for wood-burning stoves. They are quite thick, so you can split them down if you are careful.)
Proud Mary, Wed Jan 11 2012, 07:28PM
radhoo wrote ...
...the tubes that is damaged and I mentioned before is G15H . I got it from the atomic institute directly, so it was only used in adequate equipment. It's the small sized type not more than 10cm in length, so was probably used with stronger sources.
...the tubes that is damaged and I mentioned before is G15H . I got it from the atomic institute directly, so it was only used in adequate equipment. It's the small sized type not more than 10cm in length, so was probably used with stronger sources.
An atomic institute could probably reach the maximum count life of G15H very quickly indeed!

Don't let the grid of G15H float, or it will collect an unwanted charge. As a quick experiment, you could connect the grid directly to the cathode and see what happens.
If you are sure you have connected it up correctly, then I would spend no more time and money on it. Save the mica for something else. (I have used the mica sheets which you can buy new on ebay as windows for wood-burning stoves. They are quite thick, so you can split them down if you are careful.)
Re: uRADMonitor – Online remote radiation monitoring station
radhoo, Sun Sept 02 2012, 10:38AM
[moved]
radhoo, Sun Sept 02 2012, 10:38AM
[moved]
Re: uRADMonitor – Online remote radiation monitoring station
radhoo, Sun Sept 02 2012, 09:51PM
I hooked up the circuit to an atmega8 with a Ethernet interface based on the enc28j60 chip, presented here:
I added a few lines to the uC software, to have a T0 counter and a T1 timer (on the Atmega8). This way I was able to measure the pulses , the passing seconds , and have a quick way to compute the CPM.
By using the tube's datasheet information, it would be also possible to extrapolate a function for computing the dose in uSv/h.
So first tests are a success, will report back later. Experimental setup looks like this:
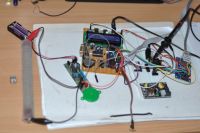
radhoo, Sun Sept 02 2012, 09:51PM
I hooked up the circuit to an atmega8 with a Ethernet interface based on the enc28j60 chip, presented here:

I added a few lines to the uC software, to have a T0 counter and a T1 timer (on the Atmega8). This way I was able to measure the pulses , the passing seconds , and have a quick way to compute the CPM.
By using the tube's datasheet information, it would be also possible to extrapolate a function for computing the dose in uSv/h.
So first tests are a success, will report back later. Experimental setup looks like this:

Re: uRADMonitor – Online remote radiation monitoring station
Proud Mary, Sun Sept 09 2012, 12:13PM
Hi Radhu old friend!
The summer is over at last, and now I am re-decorating Haus Stella before I can return to my winter experiments.
Here are a few useful features you might want to add to your programme menu, if you haven't already thought of them all:
Dead time compensation. Here you take the dead time from the datasheet and use it to calculate the number of counts that statistics predict would have occurred during the dead time intervals, and then add them automatically to the total counts. This becomes increasingly important at counting speeds over about 100 c.p.s.
Pulse pile-up compensation. Another essential for high counting speeds. Pile-up happens when pulses occur so close together that one pulse has not fully collapsed before the next one begins. A discriminator circuit is usually used here. The pile-up problem can be reduced by keeping anode capacitance as low as possible and then by electronic quenching
Total counts per hour, up to - for example - ten days. This is how you can detect small changes in the radioactive background, and do experiments which measure small effects, like determining the activity of potassium salts and other weak emitters.
Integration - average c.p.m. etc
A buffered data output to a PC
Saturation alarm: if the tube becomes paralyzed by high dose rate as in an X-ray beam.
Auto-Deduct tube's own background. This is the figure often specified in Russian datasheets, and is the counting rate when the tube is placed inside a very heavy lead chamber lined with aluminium. It is a very important figure at low count rates, as it can often exceed the true background. There is a very good but old paper on this subject here:
I look forward to seeing your next developments with this great project!
Proud Mary, Sun Sept 09 2012, 12:13PM
radhoo wrote ...
By using the tube's datasheet information, it would be also possible to extrapolate a function for computing the dose in uSv/h.
By using the tube's datasheet information, it would be also possible to extrapolate a function for computing the dose in uSv/h.
Hi Radhu old friend!
The summer is over at last, and now I am re-decorating Haus Stella before I can return to my winter experiments.
Here are a few useful features you might want to add to your programme menu, if you haven't already thought of them all:
Dead time compensation. Here you take the dead time from the datasheet and use it to calculate the number of counts that statistics predict would have occurred during the dead time intervals, and then add them automatically to the total counts. This becomes increasingly important at counting speeds over about 100 c.p.s.
Pulse pile-up compensation. Another essential for high counting speeds. Pile-up happens when pulses occur so close together that one pulse has not fully collapsed before the next one begins. A discriminator circuit is usually used here. The pile-up problem can be reduced by keeping anode capacitance as low as possible and then by electronic quenching
Total counts per hour, up to - for example - ten days. This is how you can detect small changes in the radioactive background, and do experiments which measure small effects, like determining the activity of potassium salts and other weak emitters.
Integration - average c.p.m. etc
A buffered data output to a PC
Saturation alarm: if the tube becomes paralyzed by high dose rate as in an X-ray beam.
Auto-Deduct tube's own background. This is the figure often specified in Russian datasheets, and is the counting rate when the tube is placed inside a very heavy lead chamber lined with aluminium. It is a very important figure at low count rates, as it can often exceed the true background. There is a very good but old paper on this subject here:

I look forward to seeing your next developments with this great project!

Re: uRADMonitor – Online remote radiation monitoring station
radhoo, Sun Sept 09 2012, 02:43PM
Hi Proud Mary, good to see you back on 4HV, guess you've had a nice summer holiday.
Thanks for your excellent suggestions, I was familiar with some of the ideas (that centronics material really helped me, wish it was more than a single chapter) as for the rest, it's great to see how much can be improved with the correct approach.
I'll see how to integrate as many as possible of these good ideas.
Currently I'm changing the HV supply from my feedback controlled transistor version, to a PWM driven inverter, so the microcontroller would do everything on its own with little additional components. Thanks to an oscilloscope that I've finally acquired, I'll be able to keep ripple to a minimum, to be sure the tube's got everything it needs.
Re: uRADMonitor – Online remote radiation monitoring station
Proud Mary, Sun Sept 09 2012, 05:56PM
A variable HV supply - 300V to 900V - would be an excellent feature, as this would enable you to change tubes, and set them correctly at the centre of the plateau voltage.
There are some older tubes that need over 900V - including the Blue Romanian Horror and the American aluminium toothpaste tube - but you can ignore these if it would be easier to keep the variable voltage range from 300 - 600V.
No great stability or supply filtering is necessary as the Geiger plateau is very broad, and the tube pulses across the measuring resistor are of the order of 1 - 3V, so they are easy to separate from noise.
The СИ-22Г/SI22G you have there is an excellent gamma tube!
I have a lot to do in the next two weeks, but will have the time to carry on with my low energy experiments then.
Proud Mary, Sun Sept 09 2012, 05:56PM
A variable HV supply - 300V to 900V - would be an excellent feature, as this would enable you to change tubes, and set them correctly at the centre of the plateau voltage.
There are some older tubes that need over 900V - including the Blue Romanian Horror and the American aluminium toothpaste tube - but you can ignore these if it would be easier to keep the variable voltage range from 300 - 600V.
No great stability or supply filtering is necessary as the Geiger plateau is very broad, and the tube pulses across the measuring resistor are of the order of 1 - 3V, so they are easy to separate from noise.
The СИ-22Г/SI22G you have there is an excellent gamma tube!

I have a lot to do in the next two weeks, but will have the time to carry on with my low energy experiments then.
Re: uRADMonitor – Online remote radiation monitoring station
radhoo, Tue Sept 11 2012, 10:19AM
I totally agree, a variable voltage would be useful for using various tubes.
However for this project, I will have to stick to 400V . The project will be boxed and placed on a remote location outside. From there it will collect data and build various graphs. I have the geiger couter , a temperature sensor, a humidity sensor and a light intensity one. If anyone has other ideas on additional hardware that I should pack in, now it's the right time to say it.
A future project might be having a geiger counter dosimeter with multiple tubes, etc, and a nice LCD display to output the data. Or even some kind of "lab-tool" for testing the tubes.
Regarding discrimination, yes, multiple pulses happen, and would be good to measure them correctly. The following pics show a few such pulses, as recorded with the oscilloscope:
 -
-
A little update on what I did. Yesterday I had to put the microcontroller software together. As I am using an ATMega8, I opted for the following:
- INT0 interrupt to count all incoming pulses on raising edge. I do not have any discriminator yet.
- T0 timer to count passing time. I configured it to generate 1.024ms events, so 976 such events will count for a second.
- T1 timer to generate PWM signal. I got it to accept variable frequency and duty factor. I will probably go for 40KHz to drive a little 2n2222 transistor that pumps the primary of a small ferrite core transformer:
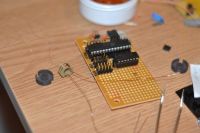
I noticed that without any protection, I will get voltage spikes in the microcontroller circuit. So a fast diode, used as snubber was needed across the primary of the small ferrite transformer . See the comparisor without and with protection:
 -
-
I still have some issues:
1. I almost used all the program memory available for the atmega8 and still need to code some additional routines. I might be forced to move to a more capable uC. I'll try to optimize and reduce code before I have to do anything like that.
2. There's some interference, between the timer1 PWM, with the ISP interface that handles the Ethernet module:
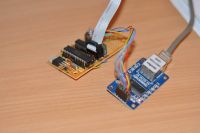
Because of that, the microcontroller hangs at some times. This is extremely annoying considering I need to have this project as a remote box running for large periods of time.
Some of the factors that are causing this:
- bigger duty cycle (timer1's PWM)
- some delays in the software's main loop
- reading ADC ports : I need to read them for sensors, and for checking the inverter voltage. The inverter produces roughly 400V when powered on. The voltage is read using one ADC port. If the voltage is less then required, the duty cycle is increased. If the voltage is bigger then the target set, the duty cycle is decreased.
I will find the cause of this eventually. As it is now, the software opens a TCP/IP socket on port 80 where it exposes some HTML content. So it is a small WEB Server, where you can see some details such as number of times it was accessed, pings received, time since startup, number of counts, CPM, and the dose in uSv/h , estimated for the SBM-19 tube.
Instead of this functionality, which I needed only for testing, the final software needs to work as a client, not a server. After computing all the sensor data locally (including the radiation dose), it will send it online, to a script running on my webpage. So instead of opening a port and waiting for incoming connections, the idea is to have it open a connecting to my server and export the data there. Easy. I believe the timing issues that currently lock my uC from time to time, will be resolved, as having an ongoing connection instead of keeping a port open is better.
Here's a photo showing the software run on a test board, with a LCD hooked up for showing the dose in uSv/h :)
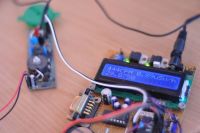
The final board will not have a display, so this is just for testing.
The software uses a 5 seconds integration to compute the CPM. Each new CPM value is averaged to the last one. For the final version I will probably use a 10second integration, but also a longer time period as a separate result.
Here it shows 444cpm, which for the SBM-19 should be 0.89uSv/h . Can anyone else double check this , please?
The radiation source was a Am241 pellet. The RD1706 shows a similar dose 0.99uSv/h at a similar distance from the source.
radhoo, Tue Sept 11 2012, 10:19AM
I totally agree, a variable voltage would be useful for using various tubes.
However for this project, I will have to stick to 400V . The project will be boxed and placed on a remote location outside. From there it will collect data and build various graphs. I have the geiger couter , a temperature sensor, a humidity sensor and a light intensity one. If anyone has other ideas on additional hardware that I should pack in, now it's the right time to say it.
A future project might be having a geiger counter dosimeter with multiple tubes, etc, and a nice LCD display to output the data. Or even some kind of "lab-tool" for testing the tubes.
Regarding discrimination, yes, multiple pulses happen, and would be good to measure them correctly. The following pics show a few such pulses, as recorded with the oscilloscope:
 -
-
A little update on what I did. Yesterday I had to put the microcontroller software together. As I am using an ATMega8, I opted for the following:
- INT0 interrupt to count all incoming pulses on raising edge. I do not have any discriminator yet.
- T0 timer to count passing time. I configured it to generate 1.024ms events, so 976 such events will count for a second.
- T1 timer to generate PWM signal. I got it to accept variable frequency and duty factor. I will probably go for 40KHz to drive a little 2n2222 transistor that pumps the primary of a small ferrite core transformer:

I noticed that without any protection, I will get voltage spikes in the microcontroller circuit. So a fast diode, used as snubber was needed across the primary of the small ferrite transformer . See the comparisor without and with protection:
 -
-
I still have some issues:
1. I almost used all the program memory available for the atmega8 and still need to code some additional routines. I might be forced to move to a more capable uC. I'll try to optimize and reduce code before I have to do anything like that.
2. There's some interference, between the timer1 PWM, with the ISP interface that handles the Ethernet module:

Because of that, the microcontroller hangs at some times. This is extremely annoying considering I need to have this project as a remote box running for large periods of time.
Some of the factors that are causing this:
- bigger duty cycle (timer1's PWM)
- some delays in the software's main loop
- reading ADC ports : I need to read them for sensors, and for checking the inverter voltage. The inverter produces roughly 400V when powered on. The voltage is read using one ADC port. If the voltage is less then required, the duty cycle is increased. If the voltage is bigger then the target set, the duty cycle is decreased.
I will find the cause of this eventually. As it is now, the software opens a TCP/IP socket on port 80 where it exposes some HTML content. So it is a small WEB Server, where you can see some details such as number of times it was accessed, pings received, time since startup, number of counts, CPM, and the dose in uSv/h , estimated for the SBM-19 tube.
Instead of this functionality, which I needed only for testing, the final software needs to work as a client, not a server. After computing all the sensor data locally (including the radiation dose), it will send it online, to a script running on my webpage. So instead of opening a port and waiting for incoming connections, the idea is to have it open a connecting to my server and export the data there. Easy. I believe the timing issues that currently lock my uC from time to time, will be resolved, as having an ongoing connection instead of keeping a port open is better.
Here's a photo showing the software run on a test board, with a LCD hooked up for showing the dose in uSv/h :)

The final board will not have a display, so this is just for testing.
The software uses a 5 seconds integration to compute the CPM. Each new CPM value is averaged to the last one. For the final version I will probably use a 10second integration, but also a longer time period as a separate result.
Here it shows 444cpm, which for the SBM-19 should be 0.89uSv/h . Can anyone else double check this , please?
The radiation source was a Am241 pellet. The RD1706 shows a similar dose 0.99uSv/h at a similar distance from the source.
Re: uRADMonitor – Online remote radiation monitoring station
radhoo, Fri Sept 14 2012, 09:23PM
I've been working on the inverter. It seems I'll be able to have it run in a very wide range of values. This is thanks to a new ferrite core transformer that I made: A22 ferite core (it is really small, 1cm diameter), 16 turns primary with 0.2mm wire, and 600 turns secondary with 0.1mm wire. It is driven by a 2n2222 generic transistor, using the 5V rail.
The output is fully rectified using 4 fast diodes set in a bridge. No multiplier required! :)
Yellow/CH1: the PWM signal driving the inverter;s transistor, at PB1 on the Atmega8
Cyan/CH2: the high voltage output after the rectifier bridge
I made some tests with various frequencies. Here are some results:
40KHZ:
 -
-
duty:12% 332V
duty:15% 344V
duty:16% 396V
duty:17% 404V
duty:25% 672V
duty:35% 792V
20KHz:
 -
-
duty:10% 392V
duty:15% 616V
15KHz:
duty:6% 352V
duty:8% 440V
duty:10% 488V
10KHz:
 -
-
duty:1% 200V
duty:6% 380V
duty:16% 768V
I will probably choose a 20KHz frequency to set it out of the audible spectrum.
I'm still having issues when using the enc28J60 code together with the Timer1 PWM code. So either I have the Ethernet interface, either I have the PWM signal for the HV inverter. Sometimes it works, but not very stable. Any ideas?
EDIT: some interesting results, and good news on the same time. Using a 8x prescalling when setting the Timer1 PWM, seems to allow the code to work together with the enc28j60, as expected. So this seems a good starting point, too bad I don't know the exact cause of these issues. Code for enc28j60 is rather complex , already.
radhoo, Fri Sept 14 2012, 09:23PM
I've been working on the inverter. It seems I'll be able to have it run in a very wide range of values. This is thanks to a new ferrite core transformer that I made: A22 ferite core (it is really small, 1cm diameter), 16 turns primary with 0.2mm wire, and 600 turns secondary with 0.1mm wire. It is driven by a 2n2222 generic transistor, using the 5V rail.
The output is fully rectified using 4 fast diodes set in a bridge. No multiplier required! :)
Yellow/CH1: the PWM signal driving the inverter;s transistor, at PB1 on the Atmega8
Cyan/CH2: the high voltage output after the rectifier bridge
I made some tests with various frequencies. Here are some results:
40KHZ:
 -
-
duty:12% 332V
duty:15% 344V
duty:16% 396V
duty:17% 404V
duty:25% 672V
duty:35% 792V
20KHz:
 -
-
duty:10% 392V
duty:15% 616V
15KHz:
duty:6% 352V
duty:8% 440V
duty:10% 488V
10KHz:
 -
-
duty:1% 200V
duty:6% 380V
duty:16% 768V
I will probably choose a 20KHz frequency to set it out of the audible spectrum.
I'm still having issues when using the enc28J60 code together with the Timer1 PWM code. So either I have the Ethernet interface, either I have the PWM signal for the HV inverter. Sometimes it works, but not very stable. Any ideas?
EDIT: some interesting results, and good news on the same time. Using a 8x prescalling when setting the Timer1 PWM, seems to allow the code to work together with the enc28j60, as expected. So this seems a good starting point, too bad I don't know the exact cause of these issues. Code for enc28j60 is rather complex , already.
Re: uRADMonitor – Online remote radiation monitoring station
radhoo, Sun Sept 16 2012, 10:12PM
The current circuit diagram, version 3.3.100:
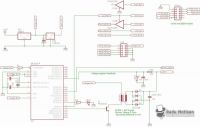
radhoo, Sun Sept 16 2012, 10:12PM
The current circuit diagram, version 3.3.100:

Re: uRADMonitor – Online remote radiation monitoring station
radhoo, Sun Sept 16 2012, 10:28PM
Update 3.3.101
I finally fixed the instability problems, the network module / PWM interference, and most of the issues I've mentioned before.
The problem was improper filtering in two key points:
1. The inverter's driver needed a little protection from those spike backs. For this I used two resistors at the inverter's driver base , and a little choke between the transformer's primary and the positive rail. This solved the spike backs:
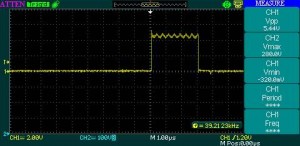
Notice the PWM waveform still seems a little shaky at the top.
2. Voltage regulators (5V and the 3.3V), needed a few electrolytic caps
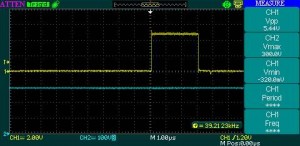
Now the PWM looks much better, and the circuit performs as expected, seems like the Ethernet module was greatly influenced by all the variations and improper filtering.
Here is the new schematic, v3.3.101:
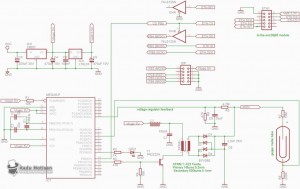
I expect to have this ready soon, now that I'm back on track with this project :)
radhoo, Sun Sept 16 2012, 10:28PM
Update 3.3.101
I finally fixed the instability problems, the network module / PWM interference, and most of the issues I've mentioned before.
The problem was improper filtering in two key points:
1. The inverter's driver needed a little protection from those spike backs. For this I used two resistors at the inverter's driver base , and a little choke between the transformer's primary and the positive rail. This solved the spike backs:

Notice the PWM waveform still seems a little shaky at the top.
2. Voltage regulators (5V and the 3.3V), needed a few electrolytic caps

Now the PWM looks much better, and the circuit performs as expected, seems like the Ethernet module was greatly influenced by all the variations and improper filtering.
Here is the new schematic, v3.3.101:

I expect to have this ready soon, now that I'm back on track with this project :)
Re: uRADMonitor – Online remote radiation monitoring station
Proud Mary, Mon Sept 17 2012, 08:12AM
Circuit v 3.2
C5 and R3 shunted by P will add to the anode capacitance, and so increase dead time and tube conduction current. What is its time constant?
C6 also looks wrong to me, as it will prevent a rapid voltage rise across R4 when the GM tube conducts, and spoil the pulse shape.
Meter circuit: You may find a range switch allowing the selection of other values of C - other time constants - in the rate meter circuit will make the instrument more useful.
Re: uRADMonitor – Online remote radiation monitoring station
radhoo, Fri Oct 12 2012, 04:43PM
Hi Stella,
The added capacitance between the anode and ground, parallel on the tube, is indeed against all recommendations, but the Russians used it in their Kvarts-01, this being the original source for the piezzo buzzer idea, see circuit diagram on:
The resulting undesired consequences should be:
- an increase of the dead time, proportional to the time needed for the parallel capacitance to charge
- reduced tube life, because it will need to handle the discharge of the parallel capacitance as well
- multiple impulses if the parallel capacitance is reasonable big: the tube voltage doesn't drop under the quenching value, so successive ionizations are possible, thanks to the high voltage level, stored in the parallel capacitance
- modification of the plateau's geometry , including shortening the plateau length or slope increase
I have already dropped all the three components you've mentioned, because I do not need them for the digital version 3.3.x, where the goal is to have a clean, simple connection between the signal collecting point at the cathode, and the microcontroller entry pin. Feel free to check the 3.3.X diagram, but I also need to publish an update with my recent results.
Nevertheless, even with the undesired parallel capacitance, the impulses still look as expected:
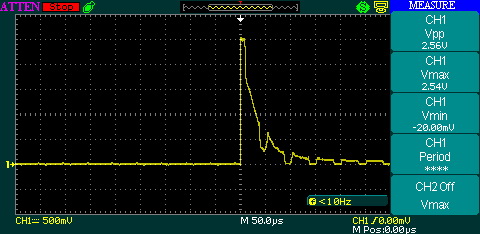
I'd say it's not that bad, at least on a first impression.
radhoo, Fri Oct 12 2012, 04:43PM
Hi Stella,
The added capacitance between the anode and ground, parallel on the tube, is indeed against all recommendations, but the Russians used it in their Kvarts-01, this being the original source for the piezzo buzzer idea, see circuit diagram on:

The resulting undesired consequences should be:
- an increase of the dead time, proportional to the time needed for the parallel capacitance to charge
- reduced tube life, because it will need to handle the discharge of the parallel capacitance as well
- multiple impulses if the parallel capacitance is reasonable big: the tube voltage doesn't drop under the quenching value, so successive ionizations are possible, thanks to the high voltage level, stored in the parallel capacitance
- modification of the plateau's geometry , including shortening the plateau length or slope increase
I have already dropped all the three components you've mentioned, because I do not need them for the digital version 3.3.x, where the goal is to have a clean, simple connection between the signal collecting point at the cathode, and the microcontroller entry pin. Feel free to check the 3.3.X diagram, but I also need to publish an update with my recent results.
Nevertheless, even with the undesired parallel capacitance, the impulses still look as expected:

I'd say it's not that bad, at least on a first impression.
Re: uRADMonitor – Online remote radiation monitoring station
radhoo, Fri Oct 12 2012, 04:55PM
Some news. Got the new little board up an running, featuring an Atmega168 micocontroller instead of the original Atmega8, because the TCP/IP stack was already consuming 7KB of our Atmega8's 8KB total flash memory. Besides the network stack, I need to drive the HV inverter, check the HV value for regularization, count the time and the pulses, do some logic on those values, and so on... additional programming that would not fit in the Atmega8.
What should have been a simple task, since the 168 has the same pin layout like the Atmega8, ended up as a mess, wasting two days of my time. I will structure the findings and indicate the critical issues, in case others will walk this path.
In the end, it works... not yet in the final form, as I need to build charts and store the data, add sensors, and lots of bells and whistles, BUT, here is how it looks like:
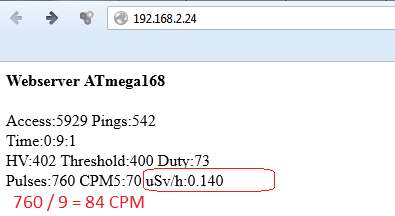
The software computes a CPM value based on a 5seconds time constant and displays the corresponding Sieverts/Hour dose in regards to the SBM-19 Geiger tube characteristics. In red, I computed the longer-term CPM value manually.
The board is currently up and running for a stability test, and can be accessed over the internet, here. Give it a run, and let me know what you think!
radhoo, Fri Oct 12 2012, 04:55PM
Some news. Got the new little board up an running, featuring an Atmega168 micocontroller instead of the original Atmega8, because the TCP/IP stack was already consuming 7KB of our Atmega8's 8KB total flash memory. Besides the network stack, I need to drive the HV inverter, check the HV value for regularization, count the time and the pulses, do some logic on those values, and so on... additional programming that would not fit in the Atmega8.
What should have been a simple task, since the 168 has the same pin layout like the Atmega8, ended up as a mess, wasting two days of my time. I will structure the findings and indicate the critical issues, in case others will walk this path.
In the end, it works... not yet in the final form, as I need to build charts and store the data, add sensors, and lots of bells and whistles, BUT, here is how it looks like:

The software computes a CPM value based on a 5seconds time constant and displays the corresponding Sieverts/Hour dose in regards to the SBM-19 Geiger tube characteristics. In red, I computed the longer-term CPM value manually.
The board is currently up and running for a stability test, and can be accessed over the internet, here. Give it a run, and let me know what you think!
Re: uRADMonitor – Online remote radiation monitoring station
Proud Mary, Fri Oct 12 2012, 06:37PM
Great work, Radhu!
I think perhaps you should extend the integration time when measuring very low dose rates like background <1 μSv/hr. Every time I look it is different. Maybe see how level you can keep it with 5 and 10 minute measuring cycles?
Proud Mary, Fri Oct 12 2012, 06:37PM
Great work, Radhu!
I think perhaps you should extend the integration time when measuring very low dose rates like background <1 μSv/hr. Every time I look it is different. Maybe see how level you can keep it with 5 and 10 minute measuring cycles?
Re: uRADMonitor – Online remote radiation monitoring station
radhoo, Fri Oct 12 2012, 06:42PM
Hi Proud Mary, good timing! I was hoping you'll get to see the link and give it a run.
Sure, I will increase the integration time, this was made so only to make testing easier.
I have completed the work for a few sensors, that will work together with the tube: temperature, humidity and luminosity. I will add an atmospheric pressure sensor too, if it gets here in time. Curious to see what will the long term data show.
What do you think about the tube I've selected for the task? The SBM-19?
Re: uRADMonitor – Online remote radiation monitoring station
Proud Mary, Fri Oct 12 2012, 07:18PM
I haven't tried SBM-19 myself, but the 0.1% slope looks good, and the working voltage range makes for an easy life. If I was building a geophysical observatory, I'd run that tube directly from rectified mains voltage, and have one less thing to break down.
Geomagnetism is a very interesting property to measure in conjunction with background radiation.
Is your CPM/μSv conversion calibrated against Cs-137 or Co-60? Remember that the conversion figure will be totally meaningless below ~ 100 kV, when all GM tubes have large non-linearity of energy response. You can wrap Sn foil around the tube (or part of it) to compensate for this, but then you will have a loss of sensitivity, as you know.
Re: uRADMonitor – Online remote radiation monitoring station
radhoo, Fri Oct 12 2012, 07:33PM
Not yet,
Unfortunately energy response compensation is a big issue at the moment and I don't have an immediate solution for solving it. My Cs137 source is not suitable to perform such a calibration, not to mention the rest of the equipment required. So all I can do is use literature sources and put some good tips into practice.
Another option is dropping the geiger tube and using a scintillation probe instead. I'll post some interesting pics in a few minutes.
Besides the energy response compensation shield, the conversion cpm->usv/h is not a priority, since I can always build the graph using CPMs and leave the conversion to the readers. CPM data will still be valuable by itself. Another option is post-processing the CPM data provided by this device. That allows endless calculations without actually changing the detector.
Please see the picture attached. Original link:


Re: uRADMonitor – Online remote radiation monitoring station
Proud Mary, Fri Oct 12 2012, 07:49PM
CPM is always true, but there are many and complex variables converting CPM into a dose rate, as you know, and if it was my project, I would not bother.
Proud Mary, Fri Oct 12 2012, 07:49PM
CPM is always true, but there are many and complex variables converting CPM into a dose rate, as you know, and if it was my project, I would not bother.
Re: uRADMonitor – Online remote radiation monitoring station
radhoo, Fri Oct 12 2012, 07:55PM
radhoo, Fri Oct 12 2012, 07:55PM
Proud Mary wrote ...
CPM is always true, but there are many and complex variables converting CPM into a dose rate, as you know, and if it was my project, I would not bother.
Yes, this is probably the best option, given my limited tools at this moment.CPM is always true, but there are many and complex variables converting CPM into a dose rate, as you know, and if it was my project, I would not bother.
Re: uRADMonitor – Online remote radiation monitoring station
Proud Mary, Sat Oct 13 2012, 10:00AM
I have just realised that a GM tube will be perfectly good for observing most background radiation because the three main terrestrial components of background gammas are K-40 1462 keV, Bi-214 1760 keV from the U decay series, and Tl-206 from the Th decay series. Smaller contributions to total background come from Pb-212 239 keV, Bi-209 609 keV, Tl-208 908 keV and Bi-214 1120 keV
As you know, the most serious non-linearity of energy response in uncompensated GM tubes occurs below 150 keV - and most of that below 100 keV - so none of the background emissions I've listed above will be seriously affected, nor will the majority of cosmic rays.
The most seriously affected - and, in many ways, the most interesting - part of the background gamma spectrum that will fall within the GM tube's most non-linear energy response region is skyshine - the radiation scattered by the air above both natural and man-made sources like particle accelerators, reactors, and high-level waste dumps. Most skyshine falls below 500 keV, and most of that below 100 keV. However, unless you live near a uranium ore body, or a nuclear facility, or we have another Chernobyl event, skyshine will not be a significant part of data gathered by a GM tube!
So, I would say that CPM to μSv/hr conversions using manufacturers data based on either Cs-137 or Co-60 will not be too inaccurate to be of use across the natural background gamma spectrum. An integration period of four hours should be used for reliable gamma background assessment.
Proud Mary, Sat Oct 13 2012, 10:00AM
I have just realised that a GM tube will be perfectly good for observing most background radiation because the three main terrestrial components of background gammas are K-40 1462 keV, Bi-214 1760 keV from the U decay series, and Tl-206 from the Th decay series. Smaller contributions to total background come from Pb-212 239 keV, Bi-209 609 keV, Tl-208 908 keV and Bi-214 1120 keV
As you know, the most serious non-linearity of energy response in uncompensated GM tubes occurs below 150 keV - and most of that below 100 keV - so none of the background emissions I've listed above will be seriously affected, nor will the majority of cosmic rays.
The most seriously affected - and, in many ways, the most interesting - part of the background gamma spectrum that will fall within the GM tube's most non-linear energy response region is skyshine - the radiation scattered by the air above both natural and man-made sources like particle accelerators, reactors, and high-level waste dumps. Most skyshine falls below 500 keV, and most of that below 100 keV. However, unless you live near a uranium ore body, or a nuclear facility, or we have another Chernobyl event, skyshine will not be a significant part of data gathered by a GM tube!

So, I would say that CPM to μSv/hr conversions using manufacturers data based on either Cs-137 or Co-60 will not be too inaccurate to be of use across the natural background gamma spectrum. An integration period of four hours should be used for reliable gamma background assessment.
Re: uRADMonitor – Online remote radiation monitoring station
radhoo, Sat Oct 13 2012, 04:43PM
Those are some very pertinent and useful observations, Proud Mary, thank you for highlighting that. After all , the device will work as a natural background observer, nothing else.
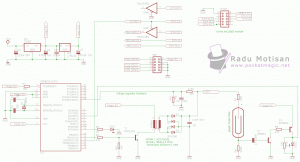
Here is the diagram for the current version 3.3.103:
Source code is also available here:
I need to build a box, and put everything together. Here's how it looks like now:
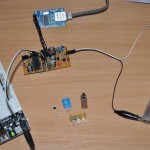
This is what you've been connecting to via the webbrowser.
Not only the box , but some changes in the software to make it export data to my blog, instead of working as a webserver. Also I need to make it support DHCP, so it would work in any switched LAN with simple plug and play. Then at the other end - on my blog's server, the exported data will be stored in a SQL data base and presented as a nice chart, with various selectable parameters. Lucky that I'm trained as a software developer... still this will take a few more days.
radhoo, Sat Oct 13 2012, 04:43PM
Those are some very pertinent and useful observations, Proud Mary, thank you for highlighting that. After all , the device will work as a natural background observer, nothing else.
Here is the diagram for the current version 3.3.103:

Source code is also available here:

I need to build a box, and put everything together. Here's how it looks like now:

This is what you've been connecting to via the webbrowser.
Not only the box , but some changes in the software to make it export data to my blog, instead of working as a webserver. Also I need to make it support DHCP, so it would work in any switched LAN with simple plug and play. Then at the other end - on my blog's server, the exported data will be stored in a SQL data base and presented as a nice chart, with various selectable parameters. Lucky that I'm trained as a software developer... still this will take a few more days.
Re: uRADMonitor – Online remote radiation monitoring station
Proud Mary, Sat Oct 13 2012, 05:45PM
This is a marvellous project, Radhu, really very good!
Just in case you thought I was asleep, you have made a little capacitor - 3pF at a guess - between the black and white wires going to the GM tube, but it would only become significant at the very high counting rates I hope you will never experience around your home.

Re: uRADMonitor – Online remote radiation monitoring station
radhoo, Sat Oct 13 2012, 09:42PM
Indeed it is preferred to shorten the wires as much as possible, and I will do that by connecting the tube's anode directly to the PCB, via a very small connector.
radhoo, Sat Oct 13 2012, 09:42PM
Indeed it is preferred to shorten the wires as much as possible, and I will do that by connecting the tube's anode directly to the PCB, via a very small connector.
Re: uRADMonitor – Online remote radiation monitoring station
Proud Mary, Sat Oct 13 2012, 09:49PM
Is there some reason why C7 is so large - 20 nF?
Proud Mary, Sat Oct 13 2012, 09:49PM
Is there some reason why C7 is so large - 20 nF?
Re: uRADMonitor – Online remote radiation monitoring station
radhoo, Sun Oct 14 2012, 09:14PM
I used the scope to view the pulse shape for several values. Initially I used a smaller cap, of a few hundred picos, but I changed it in the last version. Do you have any concerns regarding this value?
Some news: I managed to successfully initiate a Tcp/ip connection from the Geiger counter to a PHP script on my blog. It's late now, but I have everything in place to start exporting data.
Re: uRADMonitor – Online remote radiation monitoring station
Proud Mary, Mon Oct 15 2012, 07:28AM
The larger the capacitor, the slower will be the rise and fall times of the pulse. I would have expected to see a capacitor of 20 - 100 pF here - but perhaps just out of habit, because it will not make much practical difference at background counting rate speeds using a single GM tube.
Proud Mary, Mon Oct 15 2012, 07:28AM
wrote ...
I used the scope to view the pulse shape for several values. Initially I used a smaller cap, of a few hundred picos, but I changed it in the last version. Do you have any concerns regarding this value?
Some news: I managed to successfully initiate a Tcp/ip connection from the Geiger counter to a PHP script on my blog. It's late now, but I have everything in place to start exporting data.
The larger the capacitor, the slower will be the rise and fall times of the pulse. I would have expected to see a capacitor of 20 - 100 pF here - but perhaps just out of habit, because it will not make much practical difference at background counting rate speeds using a single GM tube.
Re: uRADMonitor – Online remote radiation monitoring station
radhoo, Thu Oct 18 2012, 09:42PM
You're a gold mine - providing all these direct hints, many thanks for this suggestion resulting in yet another improvement.
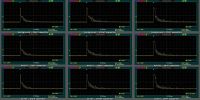
I had added a few scope pics, to illustrate the differences in pulse length, in regards to the capacitor used:
Here are 3 sets of 3 pictures, first row is with background radiation, second is with a weak Am241 source, and third is with a Cs137 source. First column shows a signal collected with a 33pF capacitor, second corresponds to a 150pF capacitor, and third column is for the 20nF capacitor.
Update,
Sensors and microcontroller software are finally working together. This project was full of obstacles, almost every single step came with bugs and issues, but eventually my determination prevailed. Here's the data received on my server, comments added after //
id=1 // this is a simple id, in case I will build more of these devices
cip=192.168.2.153 // the local device IP obtained by DHCP - no network config required!
vol=400 // the voltage on tube
duty=74 // 7.4% inverter's duty cycle responsible of the 400V produced - used in regularization
pulses=2463 // number of pulses counted since start up
s1t=22 // ds1820 sensor, this is temperature in degrees celsius
s2t=24 // dht11 sensor, temperature in degrees celsius
s2h=75 // dht11 sensor, relative humidity
s3l=19 // photodiode sensor, luminosity
td=0 // number of days since start up
th=0 // number of hours since startup
tm=16 // numer of minutes since startup
ts=41 // seconds from startup
cpm=72 // CPM for the last 5 seconds , just for debugging purposes
absolute CPM would be 2463 / 16.6 ->148 cpm . a bit high I'd say
...
pulses=4166
th=0
tm=38
ts=11
absolute CPM: 109.63 cpm , it is getting closer to expected dose rate.
radhoo, Thu Oct 18 2012, 09:42PM
You're a gold mine - providing all these direct hints, many thanks for this suggestion resulting in yet another improvement.
I had added a few scope pics, to illustrate the differences in pulse length, in regards to the capacitor used:
Here are 3 sets of 3 pictures, first row is with background radiation, second is with a weak Am241 source, and third is with a Cs137 source. First column shows a signal collected with a 33pF capacitor, second corresponds to a 150pF capacitor, and third column is for the 20nF capacitor.

Update,
Sensors and microcontroller software are finally working together. This project was full of obstacles, almost every single step came with bugs and issues, but eventually my determination prevailed. Here's the data received on my server, comments added after //
id=1 // this is a simple id, in case I will build more of these devices
cip=192.168.2.153 // the local device IP obtained by DHCP - no network config required!
vol=400 // the voltage on tube
duty=74 // 7.4% inverter's duty cycle responsible of the 400V produced - used in regularization
pulses=2463 // number of pulses counted since start up
s1t=22 // ds1820 sensor, this is temperature in degrees celsius
s2t=24 // dht11 sensor, temperature in degrees celsius
s2h=75 // dht11 sensor, relative humidity
s3l=19 // photodiode sensor, luminosity
td=0 // number of days since start up
th=0 // number of hours since startup
tm=16 // numer of minutes since startup
ts=41 // seconds from startup
cpm=72 // CPM for the last 5 seconds , just for debugging purposes
absolute CPM would be 2463 / 16.6 ->148 cpm . a bit high I'd say
...
pulses=4166
th=0
tm=38
ts=11
absolute CPM: 109.63 cpm , it is getting closer to expected dose rate.
Re: uRADMonitor – Online remote radiation monitoring station
radhoo, Thu Oct 18 2012, 10:20PM
Sensor board:
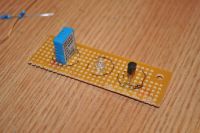
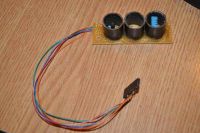
I made it with the 2cm little tubes, so I can mount it with the openings downside, to prevent rain from getting to the electronic components, and still keep the sensors in good contact with the air, to measure temperature and humidity.
Dose update:
pulses=7176
td=0
th=1
tm=14
CPM: 96cpm
Hope to have the chart software ready by tomorrow. I also need to build some kind of waterproof case for the entire setup.
radhoo, Thu Oct 18 2012, 10:20PM
Sensor board:


I made it with the 2cm little tubes, so I can mount it with the openings downside, to prevent rain from getting to the electronic components, and still keep the sensors in good contact with the air, to measure temperature and humidity.
Dose update:
pulses=7176
td=0
th=1
tm=14
CPM: 96cpm
Hope to have the chart software ready by tomorrow. I also need to build some kind of waterproof case for the entire setup.
Re: uRADMonitor – Online remote radiation monitoring station
Proud Mary, Thu Oct 18 2012, 10:35PM
I thought you would like to see how very much you have improved the accuracy and usefulness of your survey meter by using PIC:
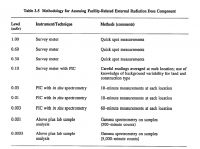
This resolution down to 0.1 mSv will give your annual rates a very useful degree of accuracy, when you look at the dose rate ranges
you are likely to find in practice (and without a nuclear disaster, of course!)

Proud Mary, Thu Oct 18 2012, 10:35PM
I thought you would like to see how very much you have improved the accuracy and usefulness of your survey meter by using PIC:

This resolution down to 0.1 mSv will give your annual rates a very useful degree of accuracy, when you look at the dose rate ranges
you are likely to find in practice (and without a nuclear disaster, of course!)

Re: uRADMonitor – Online remote radiation monitoring station
radhoo, Fri Oct 19 2012, 08:47AM
How about the integration time constant? Is there any criteria for choosing an optimum value? I'll be building graphs, with selectable time interval, but they should be a collection of cpms collected over the given interval.
radhoo, Fri Oct 19 2012, 08:47AM
How about the integration time constant? Is there any criteria for choosing an optimum value? I'll be building graphs, with selectable time interval, but they should be a collection of cpms collected over the given interval.
Re: uRADMonitor – Online remote radiation monitoring station
Conundrum, Fri Oct 19 2012, 10:41AM
Interesting thread.
Does anyone here have any experience with the "micro" Russian tubes, got two here that are still waiting for a suitable driver and host.
I got one working about a year ago with a makeshift supply based on a personal attack alarm which was enough to prove they worked but were highly inefficient.
It did get me thinking though, winding a very fine copper coil around the tube and passing about an amp through it should increase the sensitivity, and could also double as a detector if connected to something like a MK484 as the slightest ionisation event should then be detectable.
Set it to an unused frequency like 40 kHz so it doesen't detect Droitwicz or Rugby.
Another interesting idea, make a primitive induction driver so that the tube is running with 40 kHz and then detect the change in current corresponding to an ionisation event.
Essentially the tube then becomes part of a tuned circuit so the slightest change in impedance then results in a pulse.
-A
Re: uRADMonitor – Online remote radiation monitoring station
Proud Mary, Fri Oct 19 2012, 11:24AM
I have seen 4 hours given as the optimum integration period for background radiation counting, but cannot immediately find the references for it.
However, 4 hours may be too long to identify and quantify some common causes of background variation. For example, Rn-222 is released from cracks and fissures in rocks in response to changes in temperature and atmospheric pressure. This released radon is not evenly distributed through the lower atmosphere. "Under early morning still air conditions, Rn and its daughters can be trapped close to the ground in temperature inversion layers."*
I guess the most useful approach for a PIC based monitor is to have all your count/time data in a bin, so that you can ask any counts-versus-time questions you like about it. Data can then be tested against variables such as sunrise and sunset times for every day of the year, which impact on diurnal background variation. Maybe even the phases of the moon may have some small effect on the rate of diffusion of Rn into the atmosphere from soil and rocks, as it does with the sea and its tides. Who can say? Times during which rain is falling (a rain detector sensor?) may also produce interesting variations in count rate.
* Minty BRS, Luyendyk APJ, Brodie RC, Calibration and data processing for airborne gamma-ray spectrometry AGSO Journal of Australian Geology and Geophysics, 17 (2), p. 53
Proud Mary, Fri Oct 19 2012, 11:24AM
radhoo wrote ...
How about the integration time constant? Is there any criteria for choosing an optimum value? I'll be building graphs, with selectable time interval, but they should be a collection of cpms collected over the given interval.
How about the integration time constant? Is there any criteria for choosing an optimum value? I'll be building graphs, with selectable time interval, but they should be a collection of cpms collected over the given interval.
I have seen 4 hours given as the optimum integration period for background radiation counting, but cannot immediately find the references for it.
However, 4 hours may be too long to identify and quantify some common causes of background variation. For example, Rn-222 is released from cracks and fissures in rocks in response to changes in temperature and atmospheric pressure. This released radon is not evenly distributed through the lower atmosphere. "Under early morning still air conditions, Rn and its daughters can be trapped close to the ground in temperature inversion layers."*
I guess the most useful approach for a PIC based monitor is to have all your count/time data in a bin, so that you can ask any counts-versus-time questions you like about it. Data can then be tested against variables such as sunrise and sunset times for every day of the year, which impact on diurnal background variation. Maybe even the phases of the moon may have some small effect on the rate of diffusion of Rn into the atmosphere from soil and rocks, as it does with the sea and its tides. Who can say? Times during which rain is falling (a rain detector sensor?) may also produce interesting variations in count rate.
* Minty BRS, Luyendyk APJ, Brodie RC, Calibration and data processing for airborne gamma-ray spectrometry AGSO Journal of Australian Geology and Geophysics, 17 (2), p. 53
Re: uRADMonitor – Online remote radiation monitoring station
radhoo, Fri Oct 19 2012, 10:11PM
Indeed 4Hours is too much, but I will export data on a shorter interval, and offer the option to calculate an average for the chosen time interval . So we'll have both a higher resolution, and a better integrated result, depending on the user's interest. I'll detail the algorithm later.
Regarding the rain sensor, I'm also expecting an increase in dose in the first minutes of falling rain, but we'll see. The rain itself should be detectable using the humidity sensor, combined with readings from the pressure sensor (I didn't receive it yet, I'll have to add it later).
The good thing about microcontrollers is that they offer a lot of freedom for processing all the data, exactly like a small (but limited) computer.
@Conundrum: what tubes are those?
Update:
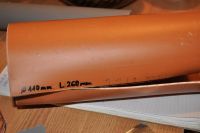
- box ready, completely made of PVC pipe plastic, after transforming a piece of pipe into a sheet and cutting it when heated.

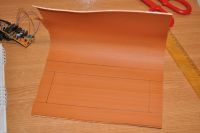
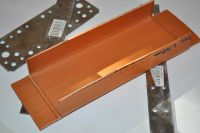
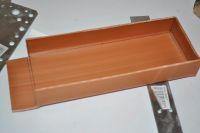
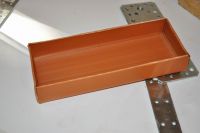
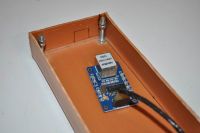
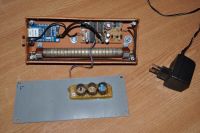
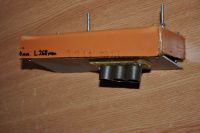
I also created sockets, from the same plastic source, for the geiger tube:
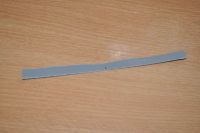
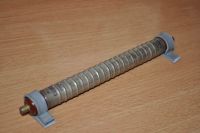

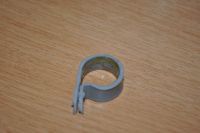
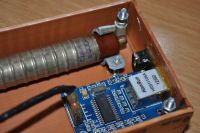
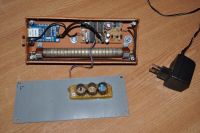
The orange plastic is great, the finished box actually gives the impression of a very good quality plastic / case, similar to older materials! Funny considering what I've used.
radhoo, Fri Oct 19 2012, 10:11PM
Indeed 4Hours is too much, but I will export data on a shorter interval, and offer the option to calculate an average for the chosen time interval . So we'll have both a higher resolution, and a better integrated result, depending on the user's interest. I'll detail the algorithm later.
Regarding the rain sensor, I'm also expecting an increase in dose in the first minutes of falling rain, but we'll see. The rain itself should be detectable using the humidity sensor, combined with readings from the pressure sensor (I didn't receive it yet, I'll have to add it later).
The good thing about microcontrollers is that they offer a lot of freedom for processing all the data, exactly like a small (but limited) computer.
@Conundrum: what tubes are those?
Update:
- box ready, completely made of PVC pipe plastic, after transforming a piece of pipe into a sheet and cutting it when heated.


I also created sockets, from the same plastic source, for the geiger tube:


The orange plastic is great, the finished box actually gives the impression of a very good quality plastic / case, similar to older materials! Funny considering what I've used.
Re: uRADMonitor – Online remote radiation monitoring station
Proud Mary, Sat Oct 20 2012, 10:00AM
First Prize for the plastic box! Wonderfully inventive!
Proud Mary, Sat Oct 20 2012, 10:00AM
First Prize for the plastic box! Wonderfully inventive!
Re: uRADMonitor – Online remote radiation monitoring station
radhoo, Sat Oct 20 2012, 11:43AM
I love that plastic. I think I'll be using again. Need to find some better tools for it, as it has potential.
I'm preparing to mount the enclosure outside. Last modifications on the software - but will be able to change it again if required (via a longer cable).
In regards to my last post, my idea for the data export is as follows:
Given a number of pulses, and a timer counting seconds, one can choose to compute the CPM using various intervals for time integration:
What my counter proposes to calculate, is the following function:
f(t) = p
Where t is the time and p are the pulses.
for the given time values (with 0 as reference):
t1 = 0 .. 1 minute (length 1 min)
t2 = 1 .. 2 minute (length 1 min)
...
t10 = 9..10 minute (length 1min)
We'll have the corresponding values f(t1)=p1 ... f(t10) = p10
Computing the CPM's as cpm1 = f(t1)/t1, ... , cpm10 = f(t10)/t10 will give use highly variable results, as Proud Mary kindly indicated, a value of 4 hours is indicated for CPM integration.
Nevertheless, we have the option of computing cpm1, ...cpm10 (each on 1 minute interval) and export them .
This data can be further process, and the time integration can be extended to any higher value as follows:
cpm_10minutes = (cpm1+...+cpm10) / 10
cpm_4hours = (cpm1+...cpm240) / 240 = (f(t1)/t1 + ... f(t240)/t240)/240 =
= ( because t1 = t2 = ... = t240 = 1minute) = (f(t1) + f(t2) + ... f(t240))/240 =
= (p1+p2+...p240) / 240
Resulting that making the average of smaller time value cpms for a given total time T, gives the same result like counting all pulses during T, and dividing that to T.
So I'll leave the option to choose the time integration constant for the post processing part or make it selectable by the user.
For now I will export CPMs calculated on a 1minute basis, or 10minutes , depending on the total data size estimate (in bytes) , so my server storage can handle it for a few years.
Re: uRADMonitor – Online remote radiation monitoring station
radhoo, Sat Oct 20 2012, 03:43PM
update: I drilled a hole in one of my home's walls, and mounted the enclosure outside. Installed power cable and crimped ethernet cable. Data is getting in to my server already.
Looks like there's a nice 22* temperature outside with normal background radiation, so time for a break for a little walk :)
Re: uRADMonitor – Online remote radiation monitoring station
Proud Mary, Sat Oct 20 2012, 04:08PM
Have you thought about a Java real time plotting/charting graph so users could look at dose rate trends - past 24 hours, past week, past month, past year?
This is exactly what people will want to see next time there is a nuclear accident. Is it going up, and by how much?
Re: uRADMonitor – Online remote radiation monitoring station
radhoo, Sat Oct 20 2012, 05:29PM
Yes, this is exactly what I'm planning to have! I'm currently working on this part, and will probably have a first version by tomorrow.
radhoo, Sat Oct 20 2012, 05:29PM
Yes, this is exactly what I'm planning to have! I'm currently working on this part, and will probably have a first version by tomorrow.
Re: uRADMonitor – Online remote radiation monitoring station
Proud Mary, Sat Oct 20 2012, 05:58PM
Good man!
Proud Mary, Sat Oct 20 2012, 05:58PM
Good man!
Re: uRADMonitor – Online remote radiation monitoring station
radhoo, Sat Oct 20 2012, 11:03PM
2am,... but I have the first results...I just hope this will not kill my server, as I didn't implement caching yet:

This link seems to point to a static picture. This not the case. The link points to a PHP script, that reads the values in a SQL database on my server, and creates a PNG image on-the-fly, that is offered to the web browser for display. You will see that if you hit "REFRESH", this "PICTURE" will be updated in real time. Remember that data is sent every minute. So make sure you wait at least one minute before hitting refresh.
The picture above shows the radiation level measured at my location by the device I've constructed. The radiation is measured in CPMs. Blue shows the absolute average. I'll need to make the time interval selectable (last day, month, year, etc), and provide a very raw estimation in uSv/h.
Here are other charts, with the other sensor data:
Temperature comparison between DS1820 (red) and DHT11(cyan) and the average in Blue:

Humidity:

Luminosity (mostly 0 as it is night here, and a few positives from passing cars):

Please note: There is no caching implemented yet, meaning that each time a picture is displayed for you in your browser, my server will have a little bit of work for doing SQL queries and building images on the fly. Please take this into account when pressing REFRESH multiple times. I'll optimize the system later.
It's been a long project, but it finally shows some results :)
radhoo, Sat Oct 20 2012, 11:03PM
2am,... but I have the first results...I just hope this will not kill my server, as I didn't implement caching yet:

This link seems to point to a static picture. This not the case. The link points to a PHP script, that reads the values in a SQL database on my server, and creates a PNG image on-the-fly, that is offered to the web browser for display. You will see that if you hit "REFRESH", this "PICTURE" will be updated in real time. Remember that data is sent every minute. So make sure you wait at least one minute before hitting refresh.
The picture above shows the radiation level measured at my location by the device I've constructed. The radiation is measured in CPMs. Blue shows the absolute average. I'll need to make the time interval selectable (last day, month, year, etc), and provide a very raw estimation in uSv/h.
Here are other charts, with the other sensor data:
Temperature comparison between DS1820 (red) and DHT11(cyan) and the average in Blue:

Humidity:

Luminosity (mostly 0 as it is night here, and a few positives from passing cars):

Please note: There is no caching implemented yet, meaning that each time a picture is displayed for you in your browser, my server will have a little bit of work for doing SQL queries and building images on the fly. Please take this into account when pressing REFRESH multiple times. I'll optimize the system later.
It's been a long project, but it finally shows some results :)
Re: uRADMonitor – Online remote radiation monitoring station
radhoo, Sun Oct 21 2012, 10:53PM
I changed the original graph algorithm:
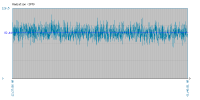
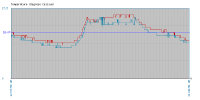
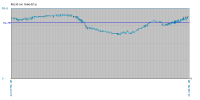
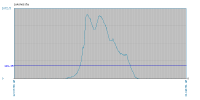
To an average based one:
The values are integrated to a 1 hour time interval. This means lower time resolution , but the evolution/tendency is easier to see.
New graph available here (or in the links above):


radhoo, Sun Oct 21 2012, 10:53PM
I changed the original graph algorithm:


To an average based one:
The values are integrated to a 1 hour time interval. This means lower time resolution , but the evolution/tendency is easier to see.
New graph available here (or in the links above):


Re: uRADMonitor – Online remote radiation monitoring station
Proud Mary, Mon Oct 22 2012, 12:37PM
Excellent, Radhu, excellent.
But what are you going to do now?
Proud Mary, Mon Oct 22 2012, 12:37PM
Excellent, Radhu, excellent.
But what are you going to do now?

Re: uRADMonitor – Online remote radiation monitoring station
radhoo, Mon Oct 22 2012, 02:40PM
I'll finish the web interface where users can get customized charts: based on integration time, data interval or just download the raw data as CSV. When the pressure sensor gets here, I'll add that as well.
Then I'll sit and wait. When enough data is obtained, I'll do a little research on it. Meanwhile you're all invited to use the monitor from time to time.
I'm also building a project page here: but I'll also upload the details in this thread's first message.
radhoo, Mon Oct 22 2012, 02:40PM
I'll finish the web interface where users can get customized charts: based on integration time, data interval or just download the raw data as CSV. When the pressure sensor gets here, I'll add that as well.
Then I'll sit and wait. When enough data is obtained, I'll do a little research on it. Meanwhile you're all invited to use the monitor from time to time.
I'm also building a project page here:
 but I'll also upload the details in this thread's first message.
Re: uRADMonitor – Online remote radiation monitoring station
Shrad, Mon Oct 22 2012, 08:30PM
what would be really nice would be to create a monitoring network of such devices, with a community around it
I'd be willing to build such a device to be part of the network, and perhaps investigate on deviations (PIN photodiode scintillator maybe, etc...)
what about several counting channels, a full meteorological sensor panel, and basic additional I/O monitoring?
I'm also an IT engineer so I could take part to developments...
Re: uRADMonitor – Online remote radiation monitoring station
radhoo, Mon Oct 22 2012, 08:38PM
I have to admit this thought crossed my mind.
radhoo, Mon Oct 22 2012, 08:38PM
I have to admit this thought crossed my mind.
Re: uRADMonitor – Online remote radiation monitoring station
radhoo, Wed Oct 24 2012, 04:23PM
More on the natural terrestrial gamma background sources:
radhoo, Wed Oct 24 2012, 04:23PM
More on the natural terrestrial gamma background sources:

Re: uRADMonitor – Online remote radiation monitoring station
IntraWinding, Wed Oct 24 2012, 05:54PM
Take it on holiday?
'Bionerd' is on a partially fan sponsored trip back to Chernobyl right now.
Check this video:
"I think if I hold this too long I'll have a radiation burn"! (18mS/hr):
IntraWinding, Wed Oct 24 2012, 05:54PM
Take it on holiday?
'Bionerd' is on a partially fan sponsored trip back to Chernobyl right now.
Check this video:
"I think if I hold this too long I'll have a radiation burn"! (18mS/hr):

Re: uRADMonitor – Online remote radiation monitoring station
Proud Mary, Wed Oct 24 2012, 07:23PM
A very good paper.
Proud Mary, Wed Oct 24 2012, 07:23PM
A very good paper.
Re: uRADMonitor – Online remote radiation monitoring station
Proud Mary, Thu Oct 25 2012, 02:55PM
Radhu, here is another paper full of useful detail on background measurement:
Background as a Residual Radioactivity Criterion for Decommissioning

Proud Mary, Thu Oct 25 2012, 02:55PM
Radhu, here is another paper full of useful detail on background measurement:
Background as a Residual Radioactivity Criterion for Decommissioning

Re: uRADMonitor – Online remote radiation monitoring station
radhoo, Fri Oct 26 2012, 02:13PM
thank you!
radhoo, Fri Oct 26 2012, 02:13PM
thank you!
Re: uRADMonitor – Online remote radiation monitoring station
radhoo, Sat Oct 27 2012, 08:48AM
It looks like rain, today! Let's see how good is that case. I don't expect any issues, though.
Maybe some interesting data related to this phenomenon?
A friend working in this field, indicated that the level of radiation detected by the device should stay almost constant. He indicated I should use a ion chamber to better track the Radon variations.
So we'll probably see a new "sensor" added to the device, soon.
Stella, what is your experience with those giga-ohmic resistors that you've purchased earlier? Are they any good? I was looking for something similar, and I found a 1000GOhm glass resistor I'm tempted to purchase.
I also got the DHT-22 sensor, and now I'm thinking about replacing the DHT-11 currently in use. If only the two humidity scales would match ...

Re: uRADMonitor – Online remote radiation monitoring station
Proud Mary, Sat Oct 27 2012, 11:21AM
"almost constant" I have been able to track small but distinct diurnal variations over 24 hour periods - a sine wave - which has been known since the early day of cosmic ray research. Google: "On the Interpretation of the Diurnal Variation of Cosmic Rays" which is a pdf I couldn't link to. It is an old one, but nice and clear for all that!
If you look through the skyshine and 'Background as a Residual Radioactivity Criterion' papers, you'll see that it is these small changes in background that contain almost all the interesting information, and what makes long term observation worthwhile. Once you have a base-line figure from months of obeservation, you'll be able to detect these smaller changes and trends, all of which have a reason behind them which it is our business to understand.
Now as for Rn-222, its daughters, and their alpha emissions, clearly these cannot be detected with a non-window GM tube, and would be much better detected with an ionisation chamber (if there are enough of them) or a scintillation device and MCA. BUT, alpha ranges are but a few cms, as we know, so alpha detection in the open air is a specialised business (as far as I understand it). Most concern about Rn is in the domestic indoors, especially in cellars, where the gas can seep up from rocks below, and accumulate to hazardous levels due to want of ventilation. In Britain, long term alpha dosimetry in high radon areas like Cornwall has been done with photochemical film badges, and more recently Track Etch Detectors, which the householder sends off to a government laboratory every three months or so. I do not think you will get any results worth having if you fix an ionisation chamber to the outisde of your house.
I think the Russian glass envelope high GΩ resistors are very good so long as we always think of the glass as a resistance in parallel with the desired resistance, and take every precaution to make sure the outside is chemically clean and dry. Deposits from finger prints WILL increase surface leakage, in a temerperature and humidity sensitive way, so the amount of leakage will not be constant, causing false readings. This applies to everyting else in the high Z part of the circuit too, especially PCB boards. Once constructed, the circuit should be placed in a sealed box with a dessicator like silica gel. I have found it very difficult to set up an ionisation chamber that is both highly sensitive and highly stable over time with good re-set accuracy - but this doesn't mean that other people won't be able to do much better!
Proud Mary, Sat Oct 27 2012, 11:21AM
radhoo wrote ...
A friend working in this field, indicated that the level of radiation detected by the device should stay almost constant. He indicated I should use a ion chamber to better track the Radon variations.
So we'll probably see a new "sensor" added to the device, soon.
A friend working in this field, indicated that the level of radiation detected by the device should stay almost constant. He indicated I should use a ion chamber to better track the Radon variations.
So we'll probably see a new "sensor" added to the device, soon.
"almost constant" I have been able to track small but distinct diurnal variations over 24 hour periods - a sine wave - which has been known since the early day of cosmic ray research. Google: "On the Interpretation of the Diurnal Variation of Cosmic Rays" which is a pdf I couldn't link to. It is an old one, but nice and clear for all that!
If you look through the skyshine and 'Background as a Residual Radioactivity Criterion' papers, you'll see that it is these small changes in background that contain almost all the interesting information, and what makes long term observation worthwhile. Once you have a base-line figure from months of obeservation, you'll be able to detect these smaller changes and trends, all of which have a reason behind them which it is our business to understand.
Now as for Rn-222, its daughters, and their alpha emissions, clearly these cannot be detected with a non-window GM tube, and would be much better detected with an ionisation chamber (if there are enough of them) or a scintillation device and MCA. BUT, alpha ranges are but a few cms, as we know, so alpha detection in the open air is a specialised business (as far as I understand it). Most concern about Rn is in the domestic indoors, especially in cellars, where the gas can seep up from rocks below, and accumulate to hazardous levels due to want of ventilation. In Britain, long term alpha dosimetry in high radon areas like Cornwall has been done with photochemical film badges, and more recently Track Etch Detectors, which the householder sends off to a government laboratory every three months or so. I do not think you will get any results worth having if you fix an ionisation chamber to the outisde of your house.
radhoo wrote ...
Stella, what is your experience with those giga-ohmic resistors that you've purchased earlier? Are they any good? I was looking for something similar, and I found a 1000GOhm glass resistor I'm tempted to purchase.
Stella, what is your experience with those giga-ohmic resistors that you've purchased earlier? Are they any good? I was looking for something similar, and I found a 1000GOhm glass resistor I'm tempted to purchase.
I think the Russian glass envelope high GΩ resistors are very good so long as we always think of the glass as a resistance in parallel with the desired resistance, and take every precaution to make sure the outside is chemically clean and dry. Deposits from finger prints WILL increase surface leakage, in a temerperature and humidity sensitive way, so the amount of leakage will not be constant, causing false readings. This applies to everyting else in the high Z part of the circuit too, especially PCB boards. Once constructed, the circuit should be placed in a sealed box with a dessicator like silica gel. I have found it very difficult to set up an ionisation chamber that is both highly sensitive and highly stable over time with good re-set accuracy - but this doesn't mean that other people won't be able to do much better!

Re: uRADMonitor – Online remote radiation monitoring station
radhoo, Sat Oct 27 2012, 11:07PM
I've completed a short film for this project:
radhoo, Sat Oct 27 2012, 11:07PM
I've completed a short film for this project:
Re: uRADMonitor – Online remote radiation monitoring station
Ash Small, Sun Oct 28 2012, 12:02AM
This is quite an impressive project, Radhoo.
I've been following it with considerable interest.
Ash Small, Sun Oct 28 2012, 12:02AM
This is quite an impressive project, Radhoo.
I've been following it with considerable interest.
Re: uRADMonitor – Online remote radiation monitoring station
mikeselectricstuff, Sun Oct 28 2012, 11:07AM
Does having a full-wave rectifier make much difference vs. half-wave? With a single-ended drive like this you get most of the output on one polarity, so you may find you can lose 3 of the diodes with minimal performance loss. Obviously you do then need to make sure the windings are the right way round.
I noticed this when sending a counter through my baggage x-ray (150kVp) - counts increase as it approaches the beam but it then goes silent til it comes out the other side.
mikeselectricstuff, Sun Oct 28 2012, 11:07AM
Does having a full-wave rectifier make much difference vs. half-wave? With a single-ended drive like this you get most of the output on one polarity, so you may find you can lose 3 of the diodes with minimal performance loss. Obviously you do then need to make sure the windings are the right way round.
wrote ...
Saturation alarm: if the tube becomes paralyzed by high dose rate as in an X-ray beam.
Saturation alarm: if the tube becomes paralyzed by high dose rate as in an X-ray beam.
I noticed this when sending a counter through my baggage x-ray (150kVp) - counts increase as it approaches the beam but it then goes silent til it comes out the other side.
Re: uRADMonitor – Online remote radiation monitoring station
radhoo, Sun Oct 28 2012, 03:27PM
@Ash Small, thanks mate.
@Mike,
While not essentially important for the tube itself, you will want to minimize the ripple effect to its maximum extent, to make sure the detector runs undisturbed by various interference factors. Especially the detector/counter part. Let's take a look at the following two photos:
1.The first, shows my version 3.2 inverter output, that uses a NPN oscillating transistor in an Armstrong oscillator, and a feedback mechanism constructed with zenner diodes set for 400V, that triggers an oscillator-blocking second transistor. See the trace for CH1 - yellow, set for 400V

2. The second shows the output in 3.3, fully rectified and produced by a a precisely calculated PWM signal. See the CH2, cyan trace, set for 350V

I have plenty of diodes and do not feel the need to spare any of them, given the nice improvement in the results. But yes, it is possible to only use a single diode to rectify the inverter's output. I just don't see any reason for doing that.
radhoo, Sun Oct 28 2012, 03:27PM
@Ash Small, thanks mate.
@Mike,
While not essentially important for the tube itself, you will want to minimize the ripple effect to its maximum extent, to make sure the detector runs undisturbed by various interference factors. Especially the detector/counter part. Let's take a look at the following two photos:
1.The first, shows my version 3.2 inverter output, that uses a NPN oscillating transistor in an Armstrong oscillator, and a feedback mechanism constructed with zenner diodes set for 400V, that triggers an oscillator-blocking second transistor. See the trace for CH1 - yellow, set for 400V

2. The second shows the output in 3.3, fully rectified and produced by a a precisely calculated PWM signal. See the CH2, cyan trace, set for 350V

I have plenty of diodes and do not feel the need to spare any of them, given the nice improvement in the results. But yes, it is possible to only use a single diode to rectify the inverter's output. I just don't see any reason for doing that.
Re: uRADMonitor – Online remote radiation monitoring station
Steve Conner, Sun Oct 28 2012, 06:41PM
I don't understand how these scope traces show an improvement in the results. They are traces of two different things. The first one shows the high voltage AC output before the rectifier and smoothing capacitors, the second one shows the smoothed DC.
Steve Conner, Sun Oct 28 2012, 06:41PM
I don't understand how these scope traces show an improvement in the results. They are traces of two different things. The first one shows the high voltage AC output before the rectifier and smoothing capacitors, the second one shows the smoothed DC.
Re: uRADMonitor – Online remote radiation monitoring station
radhoo, Sun Oct 28 2012, 08:46PM
Steve, they both show "DC" , in the same place, right before the 10M resistor connected to the tube's anode.
Remember that for the first trace, there is an oscillator blocker transistor, controlled by the zenners for voltage regularization. This is why we see those huge variations, but also a frequency value is being computed by the scope. Circuit diagram here: . Scope connected before R2.
radhoo, Sun Oct 28 2012, 08:46PM
Steve Conner wrote ...
I don't understand how these scope traces show an improvement in the results. They are traces of two different things. The first one shows the high voltage AC output before the rectifier and smoothing capacitors, the second one shows the smoothed DC.
I don't understand how these scope traces show an improvement in the results. They are traces of two different things. The first one shows the high voltage AC output before the rectifier and smoothing capacitors, the second one shows the smoothed DC.
Steve, they both show "DC" , in the same place, right before the 10M resistor connected to the tube's anode.
Remember that for the first trace, there is an oscillator blocker transistor, controlled by the zenners for voltage regularization. This is why we see those huge variations, but also a frequency value is being computed by the scope. Circuit diagram here:
 . Scope connected before R2.
Re: uRADMonitor – Online remote radiation monitoring station
Steve Conner, Sun Oct 28 2012, 08:52PM
Oh, that explains the weird appearance of the pulses from your Geiger tube. Your 3.2 design was just plain wrong, the tube is supposed to run off well-regulated smooth DC.
As far as I can see from the 3.2 schematic, the problem has nothing to do with a lack of diodes. It looks like you forgot to add a smoothing capacitor to the output.
Re: uRADMonitor – Online remote radiation monitoring station
radhoo, Sun Oct 28 2012, 09:21PM
Unfortunately there is no filter capacitor in v3.2
EDIT: first thread modified. It also shows your suggestions, under 3.2.
EDIT: let's better focus on 3.3, to avoid creating confusion with the old versions.
radhoo, Sun Oct 28 2012, 09:21PM
Unfortunately there is no filter capacitor in v3.2
Steve Conner wrote ...
As far as I can see from the 3.2 schematic, the problem has nothing to do with a lack of diodes. It looks like you forgot to add a smoothing capacitor to the output.
Well, good that I moved further to 3.3 then, but I'll correct the 3.2 as well. At the time I made the 3.2, I did not have a scope.As far as I can see from the 3.2 schematic, the problem has nothing to do with a lack of diodes. It looks like you forgot to add a smoothing capacitor to the output.
EDIT: first thread modified. It also shows your suggestions, under 3.2.
Steve Conner wrote ...
Oh, that explains the weird appearance of the pulses from your Geiger tube.
What is the weird appearance you are referring to?Oh, that explains the weird appearance of the pulses from your Geiger tube.
EDIT: let's better focus on 3.3, to avoid creating confusion with the old versions.
Re: uRADMonitor – Online remote radiation monitoring station
radhoo, Sun Oct 28 2012, 10:50PM
uSv/h added:
radhoo, Sun Oct 28 2012, 10:50PM
uSv/h added:

Re: uRADMonitor – Online remote radiation monitoring station
Steve Conner, Mon Oct 29 2012, 10:48AM
See the series of little notches? That's the "weird appearance" I'm referring to. A proportional counter would interpret that as 6 or 7 pulses of different energies. I was puzzled, but now I see it's your unsmoothed power supply feeding through onto the signal.
Steve Conner, Mon Oct 29 2012, 10:48AM
radhoo wrote ...
Here is how the pulses look like:
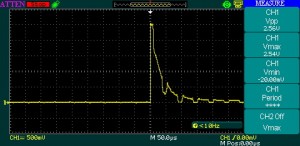
Here is how the pulses look like:

See the series of little notches? That's the "weird appearance" I'm referring to. A proportional counter would interpret that as 6 or 7 pulses of different energies. I was puzzled, but now I see it's your unsmoothed power supply feeding through onto the signal.

Re: uRADMonitor – Online remote radiation monitoring station
radhoo, Mon Oct 29 2012, 04:45PM
Steve, while your logic makes sense, I'm not sure that's the cause.
See the pulses in 3.3, looking similar to those in 3.2:
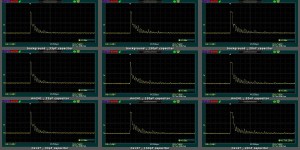
But as you already saw, 3.3 has a nice constant 400+ DC line.
If I zoom out they look like this:
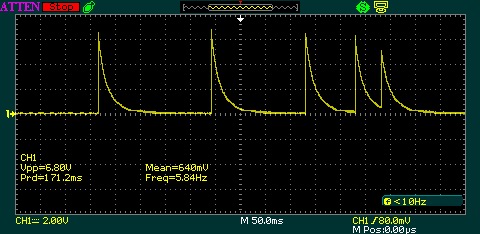
I'd say it's a perfectly normal shape. So why the saw-tooth shape in the zoomed version?
radhoo, Mon Oct 29 2012, 04:45PM
Steve, while your logic makes sense, I'm not sure that's the cause.
See the pulses in 3.3, looking similar to those in 3.2:

But as you already saw, 3.3 has a nice constant 400+ DC line.
If I zoom out they look like this:

I'd say it's a perfectly normal shape. So why the saw-tooth shape in the zoomed version?
Re: uRADMonitor – Online remote radiation monitoring station
radhoo, Wed Oct 31 2012, 10:38AM
Almost a constant.
Intresting to see that the circuit I've built can measure it without any interferences.
While the short term CPMs seem almost random, it is clear there's a tendency for the natural radiation dose of this area.
radhoo, Wed Oct 31 2012, 10:38AM
Almost a constant.
Intresting to see that the circuit I've built can measure it without any interferences.
While the short term CPMs seem almost random, it is clear there's a tendency for the natural radiation dose of this area.
Re: uRADMonitor – Online remote radiation monitoring station
Proud Mary, Thu Nov 01 2012, 01:23PM
I thought it was a train of damped waves caused by shock excitation following the steep wavefront at the instant of GM tube conduction. Reducing Ra will shorten dead time, and may attenuate the effect. Try, say, 6M8 to start with, and see if that has a helpful effect. Don't go below 3M9 without serious thought. Changing Rk away from the classical Ra/Rk = 45:1 ratio should also be considered within reason, if it seems to help with the ragged pulse tail. Moving Va down to the lower end of the plateau could also be tried.
A simple discriminator or edge detector is often used to chop off or ignore the lower parts of the pulse to separate pulses that have run together in a bulge at the bottom - a problem that increases and becomes statistically significiant with rising count rate. Discriminator level control may be set either on the front panel, or by a pre-set on the PCB.
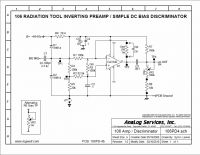
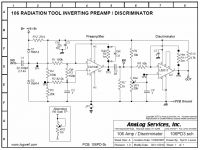
Proud Mary, Thu Nov 01 2012, 01:23PM
radhoo wrote ...
Steve, while your logic makes sense, I'm not sure that's the cause.
See the pulses in 3.3, looking similar to those in 3.2:

But as you already saw, 3.3 has a nice constant 400+ DC line.
If I zoom out they look like this:

I'd say it's a perfectly normal shape. So why the saw-tooth shape in the zoomed version?
Steve, while your logic makes sense, I'm not sure that's the cause.
See the pulses in 3.3, looking similar to those in 3.2:

But as you already saw, 3.3 has a nice constant 400+ DC line.
If I zoom out they look like this:

I'd say it's a perfectly normal shape. So why the saw-tooth shape in the zoomed version?
I thought it was a train of damped waves caused by shock excitation following the steep wavefront at the instant of GM tube conduction. Reducing Ra will shorten dead time, and may attenuate the effect. Try, say, 6M8 to start with, and see if that has a helpful effect. Don't go below 3M9 without serious thought. Changing Rk away from the classical Ra/Rk = 45:1 ratio should also be considered within reason, if it seems to help with the ragged pulse tail. Moving Va down to the lower end of the plateau could also be tried.
A simple discriminator or edge detector is often used to chop off or ignore the lower parts of the pulse to separate pulses that have run together in a bulge at the bottom - a problem that increases and becomes statistically significiant with rising count rate. Discriminator level control may be set either on the front panel, or by a pre-set on the PCB.


Re: uRADMonitor – Online remote radiation monitoring station
radhoo, Thu Nov 01 2012, 03:25PM
Thanks Proud Mary, but this is exactly why I told Steve that the 3.2 remarks might be creating confusion. The pulses are counted correctly in 3.3, and the shape looks good. I will correct the missing capacitor in 3.2 ,and publish updated diagrams, but this is of minor importance.
Dr.Nicolae Zamfir, director of Horia Hulubei National Institute of Physics and Nuclear Engineering commented in regards to my uRADMonitor construction, when contacted by the local press. My reply is in the comments section of the page:

Please use an online translator.
radhoo, Thu Nov 01 2012, 03:25PM
Thanks Proud Mary, but this is exactly why I told Steve that the 3.2 remarks might be creating confusion. The pulses are counted correctly in 3.3, and the shape looks good. I will correct the missing capacitor in 3.2 ,and publish updated diagrams, but this is of minor importance.
Dr.Nicolae Zamfir, director of Horia Hulubei National Institute of Physics and Nuclear Engineering commented in regards to my uRADMonitor construction, when contacted by the local press. My reply is in the comments section of the page:

Please use an online translator.
Re: uRADMonitor – Online remote radiation monitoring station
Proud Mary, Thu Nov 01 2012, 04:31PM
It's good to see that your project has aroused interest and is helping to raise awareness of radiaoctive pollution!
Here are a few ideas based on the criticism of your work:
You can improve the confidence level in your readings by increasing the aperture of your detector - in practice, by using multiple GM tubes.
You knew a direct conversion of CPM into dose rate would cause trouble!
You can improve your counting accuracy by dead-time compensation. The effect of this will be very very small at the low count rates of normal background, BUT it will enable you to put "Figures corrected for dead time." on your results. I've said it will be a tiny effect at low count rates, but might grow to mean something significant in measurments over very long periods of time - years, or until there is another big accident. You can calculate the real dead time of your system (that is, the GM tube as it is connected into a functioning circuit) by a simple practical test which I will paste up here if you don't know it.
Over a long period of continuous operation, it is likely that the GM tube's characteristics will change slightly. You must devise a simple test that can be repeated once a month to record the sensitivity of the tube, so you can detect the trend of any change and make corrections for it in the results.
Proud Mary, Thu Nov 01 2012, 04:31PM
radhoo wrote ...
Thanks Proud Mary, but this is exactly why I told Steve that the 3.2 remarks might be creating confusion. The pulses are counted correctly in 3.3, and the shape looks good. I will correct the missing capacitor in 3.2 ,and publish updated diagrams, but this is of minor importance.
Dr.Nicolae Zamfir, director of Horia Hulubei National Institute of Physics and Nuclear Engineering commented in regards to my uRADMonitor construction, when contacted by the local press. My reply is in the comments section of the page:

Please use an online translator.
Thanks Proud Mary, but this is exactly why I told Steve that the 3.2 remarks might be creating confusion. The pulses are counted correctly in 3.3, and the shape looks good. I will correct the missing capacitor in 3.2 ,and publish updated diagrams, but this is of minor importance.
Dr.Nicolae Zamfir, director of Horia Hulubei National Institute of Physics and Nuclear Engineering commented in regards to my uRADMonitor construction, when contacted by the local press. My reply is in the comments section of the page:

Please use an online translator.
It's good to see that your project has aroused interest and is helping to raise awareness of radiaoctive pollution!

Here are a few ideas based on the criticism of your work:
You can improve the confidence level in your readings by increasing the aperture of your detector - in practice, by using multiple GM tubes.
You knew a direct conversion of CPM into dose rate would cause trouble!
You can improve your counting accuracy by dead-time compensation. The effect of this will be very very small at the low count rates of normal background, BUT it will enable you to put "Figures corrected for dead time." on your results. I've said it will be a tiny effect at low count rates, but might grow to mean something significant in measurments over very long periods of time - years, or until there is another big accident. You can calculate the real dead time of your system (that is, the GM tube as it is connected into a functioning circuit) by a simple practical test which I will paste up here if you don't know it.
Over a long period of continuous operation, it is likely that the GM tube's characteristics will change slightly. You must devise a simple test that can be repeated once a month to record the sensitivity of the tube, so you can detect the trend of any change and make corrections for it in the results.
Re: uRADMonitor – Online remote radiation monitoring station
radhoo, Thu Nov 01 2012, 06:04PM
Once again, some excellent suggestions. Thank you!
radhoo, Thu Nov 01 2012, 06:04PM
Once again, some excellent suggestions. Thank you!
Re: uRADMonitor – Online remote radiation monitoring station
radhoo, Sun Nov 11 2012, 01:17PM
Another update:
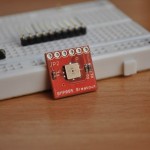
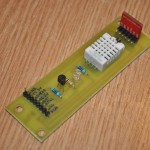
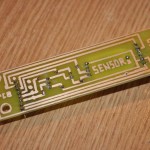
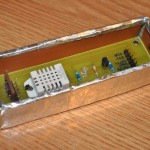
SERVER:
- added new graphs: pressure (bmp085) and temperature 3 (bmp085)
CLIENT:
- dht11 sensor replaced with dht22
- bmp085 sensor added
- new sensor PCB board
- new sensor board sun shield
- additional code for the new sensor and i2c bus connectivity
- atmega168 replaced with atmega328p
Moving from the mega168 to 328p was smooth, with no issues. A little problem is with the previous Humidity data, recorded with DHT-11, that seems to have a different scale than what I am getting from the DHT-22.
Circuit diagram, 3.3.130
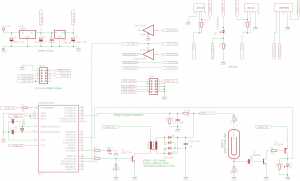
The new BMP085 sensor temperature data:

And the BMP085 pressure data, in Pascals:

radhoo, Sun Nov 11 2012, 01:17PM
Another update:


SERVER:
- added new graphs: pressure (bmp085) and temperature 3 (bmp085)
CLIENT:
- dht11 sensor replaced with dht22
- bmp085 sensor added
- new sensor PCB board
- new sensor board sun shield
- additional code for the new sensor and i2c bus connectivity
- atmega168 replaced with atmega328p
Moving from the mega168 to 328p was smooth, with no issues. A little problem is with the previous Humidity data, recorded with DHT-11, that seems to have a different scale than what I am getting from the DHT-22.
Circuit diagram, 3.3.130

The new BMP085 sensor temperature data:

And the BMP085 pressure data, in Pascals:

Re: uRADMonitor – Online remote radiation monitoring station
radhoo, Fri Nov 30 2012, 08:22AM
A lot has happened recently, after the impact this device had on local press, I got an invitation to a TV show, where I had the chance to discuss and present details behind the project. Here is a recording of the transmission on TVR3 (national TV), from 16.11.2012:
Wish there was some option to translate this to English automatically.
Re: uRADMonitor – Online remote radiation monitoring station
Proud Mary, Fri Nov 30 2012, 01:36PM
Bine făcut, prietene!
Proud Mary, Fri Nov 30 2012, 01:36PM
Bine făcut, prietene!
Re: uRADMonitor – Online remote radiation monitoring station
radhoo, Fri Nov 30 2012, 06:18PM
radhoo, Fri Nov 30 2012, 06:18PM
Proud Mary wrote ...
Bine făcut, prietene!
thanks :)Bine făcut, prietene!
Re: uRADMonitor – Online remote radiation monitoring station
Josh Campbell, Fri Nov 30 2012, 11:32PM
Wish the t-shirts were in Romanian and the dialog were in english. :)
It would be interesting to have a network of these setup on the highway system. All the data could be pooled and monitored for anomalies.
Josh Campbell, Fri Nov 30 2012, 11:32PM
Wish the t-shirts were in Romanian and the dialog were in english. :)
It would be interesting to have a network of these setup on the highway system. All the data could be pooled and monitored for anomalies.
Re: uRADMonitor – Online remote radiation monitoring station
radhoo, Sat Dec 01 2012, 02:51PM
2bytes, I'll see how to make this turn into a known open source project, so others can build their own devices. I can take care of centralizing the data, but cannot build all the devices, needed for such a purpose, by myself.
I've split this project thread into two parts - this one discussing the uRadMonitor (Network geiger counter) , and a simpler one featuring my previous builds, with their errors and lessons learned along the time.
Re: uRADMonitor – Online remote radiation monitoring station
Proud Mary, Sat Dec 01 2012, 03:37PM
Here are some questions that others must thinking, Radu.
1. I already have a GM counter that I can run continuously from the 230V mains, and a waterproof gamma probe I can mount outside. What more do I need to get the pulse output online? Do I have to be online 24/7?
2. What about the height of the GM probe above the ground? If radioactive particles fall from the sky in rain, smog, dust etc, then a GM probe nearer the ground will detect them more as they accumulate on the ground surface, than will a probe placed high up where the continuing activity of the particles that have fallen to the ground below will be absorbed by the air between. This probe height effect would be strongest with beta emitters (forgetting about alphas, unless the probe is just a few cm above the ground).
3. What about a 'monthly mean for this station'? Without this base line, the trend of a reading from any particular station would be hard to evaluate, unless it was a large effect.
Re: uRADMonitor – Online remote radiation monitoring station
radhoo, Fri Dec 07 2012, 10:06PM
I'm proud to announce this update, this Project is my second work to be featured on HackAday:
 (after my previous capacitive discharge welder cutter tool:
  )
)
The last few days have indicated that rain does raise the dose, because of Radon washout.
Also we're now getting into winter's negative temperatures, so this is the first negative range test for my temperature sensors, except testing them in my fridge, back in October.
Proud Mary, allow me to answer between your lines:
This is a very bad idea, considering the waste of power and CPU power done this way.
I suggest the approach I also used in uRadMonitor: - use a microcontroller that does everything: drive the tube, count the pulses, handle a network chip (in my case that was enc28j60). This way we have an extremely low power device that does the job.
The device can either send data online in real time, or store them internally and connect on a given time basis, to upload packs of data. My approach was to have the device send the data every minute.
Details on the construction, including an Atmega328 microcontroller and the enc28j60 can be found here (long thread):
radhoo, Fri Dec 07 2012, 10:06PM
I'm proud to announce this update, this Project is my second work to be featured on HackAday:
 (after my previous capacitive discharge welder cutter tool:
  )
)The last few days have indicated that rain does raise the dose, because of Radon washout.
Also we're now getting into winter's negative temperatures, so this is the first negative range test for my temperature sensors, except testing them in my fridge, back in October.
Proud Mary, allow me to answer between your lines:
Proud Mary wrote ...
1. I already have a GM counter that I can run continuously from the 230V mains, and a waterproof gamma probe I can mount outside. What more do I need to get the pulse output online? Do I have to be online 24/7?
One would need a network interface of some kind. The simplest approach is to keep a computer connected 24/7, and send the Geiger's counter pulse data to the computer by some means. 1. I already have a GM counter that I can run continuously from the 230V mains, and a waterproof gamma probe I can mount outside. What more do I need to get the pulse output online? Do I have to be online 24/7?
This is a very bad idea, considering the waste of power and CPU power done this way.
I suggest the approach I also used in uRadMonitor: - use a microcontroller that does everything: drive the tube, count the pulses, handle a network chip (in my case that was enc28j60). This way we have an extremely low power device that does the job.
The device can either send data online in real time, or store them internally and connect on a given time basis, to upload packs of data. My approach was to have the device send the data every minute.
Details on the construction, including an Atmega328 microcontroller and the enc28j60 can be found here (long thread):

Proud Mary wrote ...
2. What about the height of the GM probe above the ground? If radioactive particles fall from the sky in rain, smog, dust etc, then a GM probe nearer the ground will detect them more as they accumulate on the ground surface, than will a probe placed high up where the continuing activity of the particles that have fallen to the ground below will be absorbed by the air between. This probe height effect would be strongest with beta emitters (forgetting about alphas, unless the probe is just a few cm above the ground).
True! My setup places the device at about 6 meters above the ground. It is not safe to have this device placed closer than that because of the human factor. I might be able to place a lid under the counter, to act as the ground's surface and concentrate the various radioactive particles, fallen from the sky. Nevertheless it is still interesting to see the background value of the current setup - the way it is now - somewhat similar to the way people get exposed - we never lay on the ground, but we constantly move, being bombarded by whatever the atmosphere contains.2. What about the height of the GM probe above the ground? If radioactive particles fall from the sky in rain, smog, dust etc, then a GM probe nearer the ground will detect them more as they accumulate on the ground surface, than will a probe placed high up where the continuing activity of the particles that have fallen to the ground below will be absorbed by the air between. This probe height effect would be strongest with beta emitters (forgetting about alphas, unless the probe is just a few cm above the ground).
Proud Mary wrote ...
3. What about a 'monthly mean for this station'? Without this base line, the trend of a reading from any particular station would be hard to evaluate, unless it was a large effect.
A very good suggestion, I have plans to improve the graphs , but didn't have the time for this work yet.3. What about a 'monthly mean for this station'? Without this base line, the trend of a reading from any particular station would be hard to evaluate, unless it was a large effect.
Re: uRADMonitor – Online remote radiation monitoring station
Proud Mary, Fri Dec 07 2012, 10:49PM
I'll see what I can do with getting the pulses online with PicoLog or Daqarta when I am not too busy - perhaps I will be able to find time over the Christmas holidays, if I am lucky.
Proud Mary, Fri Dec 07 2012, 10:49PM
I'll see what I can do with getting the pulses online with PicoLog or Daqarta when I am not too busy - perhaps I will be able to find time over the Christmas holidays, if I am lucky.

Re: uRADMonitor – Online remote radiation monitoring station
Patrick, Fri Dec 07 2012, 11:41PM
ive had good operation from the BMP085 device (in my drones), easy to program and use if its on a breakout board.
Patrick, Fri Dec 07 2012, 11:41PM
ive had good operation from the BMP085 device (in my drones), easy to program and use if its on a breakout board.
Re: uRADMonitor – Online remote radiation monitoring station
Proud Mary, Sat Dec 08 2012, 12:18AM
I'm not going to be monitoring barometric pressure here in Steyning, but may add a SID receiver in the future.
Proud Mary, Sat Dec 08 2012, 12:18AM
Patrick wrote ...
ive had good operation from the BMP085 device (in my drones), easy to program and use if its on a breakout board.
ive had good operation from the BMP085 device (in my drones), easy to program and use if its on a breakout board.
I'm not going to be monitoring barometric pressure here in Steyning, but may add a SID receiver in the future.
Re: uRADMonitor – Online remote radiation monitoring station
radhoo, Sat Dec 08 2012, 08:28AM
radhoo, Sat Dec 08 2012, 08:28AM
Proud Mary wrote ...
I'll see what I can do with getting the pulses online with PicoLog or Daqarta when I am not too busy - perhaps I will be able to find time over the Christmas holidays, if I am lucky.
Stella, if waiting a little time is ok, I will probably be able to build another board in february 2013 which I'd be happy to send it to you. You've helped me a lot with my projects, and its the least I can do to say thanks. Until then, here on the forum we can discuss any possible improvements to incorporate in the new build. I'll add a few scope traces the next few days, to use as a starting point.I'll see what I can do with getting the pulses online with PicoLog or Daqarta when I am not too busy - perhaps I will be able to find time over the Christmas holidays, if I am lucky.

Re: uRADMonitor – Online remote radiation monitoring station
radhoo, Sat Dec 08 2012, 10:40AM
First snow:
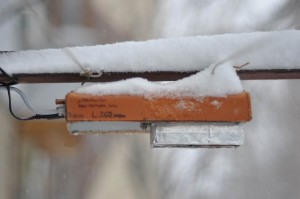
radhoo, Sat Dec 08 2012, 10:40AM
First snow:

Re: uRADMonitor – Online remote radiation monitoring station
Proud Mary, Sat Dec 08 2012, 12:12PM
That is very kind, Radu! Thank you!
Proud Mary, Sat Dec 08 2012, 12:12PM
radhoo wrote ...
Proud Mary wrote ...
I'll see what I can do with getting the pulses online with PicoLog or Daqarta when I am not too busy - perhaps I will be able to find time over the Christmas holidays, if I am lucky.
Stella, if waiting a little time is ok, I will probably be able to build another board in february 2013 which I'd be happy to send it to you. You've helped me a lot with my projects, and its the least I can do to say thanks. Until then, here on the forum we can discuss any possible improvements to incorporate in the new build. I'll add a few scope traces the next few days, to use as a starting point.I'll see what I can do with getting the pulses online with PicoLog or Daqarta when I am not too busy - perhaps I will be able to find time over the Christmas holidays, if I am lucky.

That is very kind, Radu! Thank you!

Re: uRADMonitor – Online remote radiation monitoring station
Proud Mary, Sat Dec 08 2012, 02:41PM
Here is a useful paper on the methods used by the UK government's Department of Energy and Climate Change to measure radioactivity in the air and rainwater. Some of the methods are beyond the resources of most amateurs, but there is still plenty of useful information in it:
MONITORING OF RADIOACTIVITY
IN AIR AND RAINWATER IN THE UK

Re: uRADMonitor – Online remote radiation monitoring station
radhoo, Thu Jan 31 2013, 07:33PM
First unusual event has been logged here:

The debug data shows normal device behavior, so it's unlikely to be any malfunction here.
I just wonder what might have happened during those 6 minutes???
radhoo, Thu Jan 31 2013, 07:33PM
First unusual event has been logged here:

The debug data shows normal device behavior, so it's unlikely to be any malfunction here.
I just wonder what might have happened during those 6 minutes???
Re: uRADMonitor – Online remote radiation monitoring station
Proud Mary, Thu Jan 31 2013, 08:17PM
If it is not an artifact of system or experimenter error, it certainly is very interesting. Why not see if there are any time correlations with online magnetic observatories in Eastern Europe, solar activity and VLF observatories? The Italian experimenters at Radio Waves Below 22 kHz may have data to share with you too.
Proud Mary, Thu Jan 31 2013, 08:17PM
radhoo wrote ...
First unusual event has been logged here:

The debug data shows normal device behavior, so it's unlikely to be any malfunction here.
I just wonder what might have happened during those 6 minutes???
First unusual event has been logged here:

The debug data shows normal device behavior, so it's unlikely to be any malfunction here.
I just wonder what might have happened during those 6 minutes???
If it is not an artifact of system or experimenter error, it certainly is very interesting. Why not see if there are any time correlations with online magnetic observatories in Eastern Europe, solar activity and VLF observatories? The Italian experimenters at Radio Waves Below 22 kHz
 may have data to share with you too.
 Re: uRADMonitor – Online remote radiation monitoring station
Proud Mary, Thu Jan 31 2013, 08:45PM
Another idea about your counting spike.
If your GM tube is high off the ground, and not contained in an EM shield with a low impedance Earth connection, it is possible that a passing electric storm overhead might have caused a high potential difference to develop. This might possibly push the tube to the upper end of the Geiger plateau, where the slope tilts sharply upwards on its way to the continuous conduction band.
Re: uRADMonitor – Online remote radiation monitoring station
radhoo, Thu Jan 31 2013, 08:46PM
First thing I did , was to compare the readings to those collected by a friend of mine, in Oradea, at aprox. 200km north from my location. His readings, didn't record any abnormal variations:
There is always a chance of something going wrong , but for that there are two questions:
1) why now, after 3 months of almost constant indications
2) how would such a malfunction manifest itself, since the voltage on tube remained close to 400V , and all the other parameters where in normal intervals. This spike lasted for 6 minutes, as shown in the debug data I posted, than everything went back to normal.
This is inconsistent with a technical issue scenario (like tube failure, avalanche discharges, etc).
LE: no storm involved. Today was a beautiful sunny day. The light intensity chart also jumped close to maximum:

radhoo, Thu Jan 31 2013, 08:46PM
First thing I did , was to compare the readings to those collected by a friend of mine, in Oradea, at aprox. 200km north from my location. His readings, didn't record any abnormal variations:

There is always a chance of something going wrong , but for that there are two questions:
1) why now, after 3 months of almost constant indications
2) how would such a malfunction manifest itself, since the voltage on tube remained close to 400V , and all the other parameters where in normal intervals. This spike lasted for 6 minutes, as shown in the debug data I posted, than everything went back to normal.
This is inconsistent with a technical issue scenario (like tube failure, avalanche discharges, etc).
LE: no storm involved. Today was a beautiful sunny day. The light intensity chart also jumped close to maximum:

Re: uRADMonitor – Online remote radiation monitoring station
radhoo, Thu Jan 31 2013, 08:55PM
Here's a comparison chart, between CPM values (cyan) and LUMINOSITY(red) for the last 14 days. Integration (value average) set to a 2hours interval:

radhoo, Thu Jan 31 2013, 08:55PM
Here's a comparison chart, between CPM values (cyan) and LUMINOSITY(red) for the last 14 days. Integration (value average) set to a 2hours interval:

Re: uRADMonitor – Online remote radiation monitoring station
Proud Mary, Thu Jan 31 2013, 08:56PM
What about moisture causing intermittent conduction - tracking, sparks, arcs - from the anode terminal to a point of lower potential? This would cause Va to collapse momentarily, which would be registered as a count.
Proud Mary, Thu Jan 31 2013, 08:56PM
What about moisture causing intermittent conduction - tracking, sparks, arcs - from the anode terminal to a point of lower potential? This would cause Va to collapse momentarily, which would be registered as a count.
Re: uRADMonitor – Online remote radiation monitoring station
radhoo, Thu Jan 31 2013, 09:03PM
That is an interesting idea, however the humidity chart shows the device had much harder times the last week, without a negative impact on its data accuracy:

For the last month or so, we had bad weather, with the humidity value hitting its max value (99%). On the other hand, today it was a nice warm day, and humidity was as low as 55% RH.
So the air was reasonably dry, and the temperature at that hour (18 pm ) was too high for condense to take place, above 10 degrees celsius:

Unfortunately I can't figure this out. All the sensors show very reasonable values. Nothing seems abnormal, except the CPM data. And only for 6 minutes.. than its back to normal.
Having a malfunction would be the simplest explanation, I just can't see where this fits in the story, given all the other data.
radhoo, Thu Jan 31 2013, 09:03PM
That is an interesting idea, however the humidity chart shows the device had much harder times the last week, without a negative impact on its data accuracy:

For the last month or so, we had bad weather, with the humidity value hitting its max value (99%). On the other hand, today it was a nice warm day, and humidity was as low as 55% RH.
So the air was reasonably dry, and the temperature at that hour (18 pm ) was too high for condense to take place, above 10 degrees celsius:

Unfortunately I can't figure this out. All the sensors show very reasonable values. Nothing seems abnormal, except the CPM data. And only for 6 minutes.. than its back to normal.
Having a malfunction would be the simplest explanation, I just can't see where this fits in the story, given all the other data.
Re: uRADMonitor – Online remote radiation monitoring station
radhoo, Thu Jan 31 2013, 09:09PM
The two links above point to real time data, so in case others will revisit this thread some time from now, I've also attached the static images: First is humidity, second is temperature, for the last 14 days.
Humidity:

Temperature:

radhoo, Thu Jan 31 2013, 09:09PM
The two links above point to real time data, so in case others will revisit this thread some time from now, I've also attached the static images: First is humidity, second is temperature, for the last 14 days.
Humidity:

Temperature:

Re: uRADMonitor – Online remote radiation monitoring station
Proud Mary, Thu Jan 31 2013, 10:51PM
Perhaps you should also consider strong local impulse interference, EMI, RFI.
It seems so unusual an event that you should only consider it to be a possible gamma burst when all other possibilities have been definitely excluded.
Proud Mary, Thu Jan 31 2013, 10:51PM
Perhaps you should also consider strong local impulse interference, EMI, RFI.
It seems so unusual an event that you should only consider it to be a possible gamma burst when all other possibilities have been definitely excluded.
Re: uRADMonitor – Online remote radiation monitoring station
radhoo, Fri Feb 01 2013, 08:40AM
:Product: Forecast Discussion
:Issued: 2013 Feb 01 0030 UTC
# Prepared by the U.S. Dept. of Commerce, NOAA, Space Weather Prediction Center
#
*EXPERIMENTAL PRODUCT*
Solar Activity
.24 hr Summary...
Two significant filament eruptions, at least one of which appears to be
Earth-directed, were observed during the period. The first was visible
in SDO AIA 304 imagery beginning at about 31/0439 UTC and lasting until
31/0725 UTC. This filament erupted from the southeast limb. A CME was
subsequently visible in SOHO/LASCO C2 coronagraph imagery around 31/0800
UTC. Analysis suggests the CME had an Earth-directed component and was
moving at approximately 550 km/s. No radio emissions were reported with
this event. The second filament eruption occurred in the northeast
quadrant. It was first observed in SDO AIA 304 imagery at 31/1543 UTC
and lasted until 31/1742 UTC. We are awaiting coronagraph imagery to
begin an analysis of this event. Otherwise, solar activity was low.
Region 1663 (S09W18) produced an impulsive C1 x-ray event at 31/0434
UTC. Region 1663 displayed modest growth and development over the
period, ending as the only bipolar region on the visible disk, a Cso
type group with beta magnetic characteristics.
.Forecast...
Solar activity is expected to be very low with a chance for C-class
flares, probably from Region 1663.
Energetic Particle
.24 hr Summary...
The greater than 2 MeV electron flux at geosynchronous orbit reached
moderate levels. The greater than 10 MeV proton flux at geosynchronous
orbit was at background levels.
.Forecast...
The greater than 2 MeV electron flux is expected to be at normal to
moderate levels. The greater than 10 MeV proton flux is expected to
remain at background levels.
Solar Wind
.24 hr Summary...
Solar wind at the ACE spacecraft was nominal. Wind speed was in the low
to mid 300 km/s range. Bz values ranged between 5 and -5 nT
and Bt values ranged from 1 to 4 nT. The sector orientation varied
between negative and positive throughout the day.
.Forecast...
A coronal hole is expected to become geoeffective beginning on day 2 (02
Feb) with wind speed increasing to 400 km/s. A preliminary WSA-ENLIL
model run suggests a further increase to around 450 km/s is expected
mid-day on day 3 (03 Feb) as the CME mentioned earlier scrapes by the
magnetosphere.
Geospace
.24 hr Summary...
The geomagnetic field was quiet.
.Forecast...
A coronal hole is expected to become geoeffective beginning on day 2 (02
Feb) bringing a slight chance for unsettled to active geomagnetic
conditions. A preliminary WSA-ENLIL model run suggests the CME
mentioned above will arrive mid-day on day 3 (03 Feb) bringing unsettled
to active conditions with a slight chance for minor storm conditions,
particularly at high latitudes.
Attached NOAA 3day GOES Flux Monitor chart.

Re: uRADMonitor – Online remote radiation monitoring station
radhoo, Fri Feb 01 2013, 10:28AM
and here is an interesting overlay, taking into account the time coordinates, UTC for GOES, and GMT+2 (winter hour) for uradmonitor :
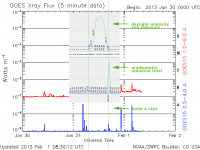
radhoo, Fri Feb 01 2013, 10:28AM
and here is an interesting overlay, taking into account the time coordinates, UTC for GOES, and GMT+2 (winter hour) for uradmonitor :

Re: uRADMonitor – Online remote radiation monitoring station
Proud Mary, Fri Feb 01 2013, 11:03AM
Do you remember a paper I sent you a few years ago about a Russian 256 tube GM array?
Apart from increasing the effective aperture, a GM tube array gives high immunity to false triggering when each tube is supplied by an independent anode supply, and parts of the array are configured in anti-coincidence mode, and other parts in coincidence mode.
A small array of 8 tubes configured as 4 pairs would give an excellent confidence interval compared with using only one. Even those crappy СИ 39Г would probably do OK in an array.

Re: uRADMonitor – Online remote radiation monitoring station
radhoo, Fri Feb 01 2013, 11:19AM
You are probably right. It's too early to jump to any conclusions. Using multiple tubes would surely bring some benefits. Maybe for the next version.
Anyway, now it's February, and the next few days I'll be building the second unit. Guess where I'm going to send that? :)
Re: uRADMonitor – Online remote radiation monitoring station
Proud Mary, Fri Feb 01 2013, 12:24PM
Plase don't hurry on my account, Radu, as I shall be very busy this month and on into March before I will have enough time to take on anything new.
Proud Mary, Fri Feb 01 2013, 12:24PM
radhoo wrote ...
You are probably right. It's too early to jump to any conclusions. Using multiple tubes would surely bring some benefits. Maybe for the next version.
Anyway, now it's February, and the next few days I'll be building the second unit. Guess where I'm going to send that? :)
You are probably right. It's too early to jump to any conclusions. Using multiple tubes would surely bring some benefits. Maybe for the next version.
Anyway, now it's February, and the next few days I'll be building the second unit. Guess where I'm going to send that? :)
Plase don't hurry on my account, Radu, as I shall be very busy this month and on into March before I will have enough time to take on anything new.
Re: uRADMonitor – Online remote radiation monitoring station
Conundrum, Sat Feb 02 2013, 07:20PM
Does anyone know where to get these tubes in bulk?
-A
Conundrum, Sat Feb 02 2013, 07:20PM
Does anyone know where to get these tubes in bulk?
-A
Re: uRADMonitor – Online remote radiation monitoring station
radhoo, Sun Feb 03 2013, 11:28PM
Stella, no need to worry about that, all it needs is a power supply and a network connector plugged in, and it does the job by itself. Just let me know if you have a router, with a permanent internet connection.
Conundrum, which tubes? SBM-19's or the SI-39's? For both there's just one answer: ex communist block :)
Re: uRADMonitor – Online remote radiation monitoring station
radhoo, Fri Feb 08 2013, 10:23AM
The second anomaly, for a total of 8 minutes, and now radiation levels are slightly higher:
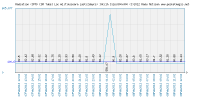
Highest CPM reading was 5175, considering an average of 81cpm .
Similar to last time, no indication of system malfunction: everything is in scale, and running continuously, except radiation data. Debug data posted here:
Probably it is time to add a backup/redundant detector to the system.
radhoo, Fri Feb 08 2013, 10:23AM
The second anomaly, for a total of 8 minutes, and now radiation levels are slightly higher:

Highest CPM reading was 5175, considering an average of 81cpm .
Similar to last time, no indication of system malfunction: everything is in scale, and running continuously, except radiation data. Debug data posted here:

Probably it is time to add a backup/redundant detector to the system.
Re: uRADMonitor – Online remote radiation monitoring station
Proud Mary, Fri Feb 08 2013, 12:09PM
This first circuit is a GM coincidence detector I found on a cosmic ray site a few years ago. I haven't tried it, but I think you'll agree that the cathode resistors look too high at 1:100 against the anode resistor. But at least they have taken the signal off the cathode, so it can't be all bad.
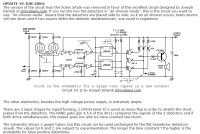
This here is a commercial anti-coincidence detector I found in a geophysics database of radiation tools.
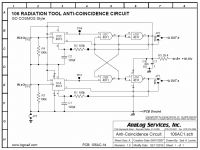
Used together in a simple array of four GM tubes, these two circuits - or variations or improvements of them - would be powerful tools to identify your anomaly.
Proud Mary, Fri Feb 08 2013, 12:09PM
This first circuit is a GM coincidence detector I found on a cosmic ray site a few years ago. I haven't tried it, but I think you'll agree that the cathode resistors look too high at 1:100 against the anode resistor. But at least they have taken the signal off the cathode, so it can't be all bad.


This here is a commercial anti-coincidence detector I found in a geophysics database of radiation tools.

Used together in a simple array of four GM tubes, these two circuits - or variations or improvements of them - would be powerful tools to identify your anomaly.
Re: uRADMonitor – Online remote radiation monitoring station
radhoo, Fri Feb 08 2013, 12:25PM
Yes, I will probably have to add that eventually, but I am also considering connecting a scintillation probe to the monitor.
While I do that, here is some more data. I have attached the maximum resolution charts, built with the data I have. What's interesting is that temperature has increased during the event with 0.5 degrees. Keep in mind that the peak happened during a cold winter night, with no sources for additional heat: except perhaps a little extra radiation, passing a bit of its energy to the air, as heat? All three temperature sensors running in parallel have recorded an increase:
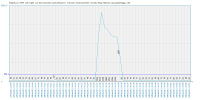
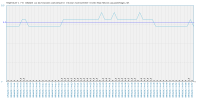


Re: uRADMonitor – Online remote radiation monitoring station
radhoo, Fri Feb 08 2013, 12:26PM
And here is the peak from January, 31:
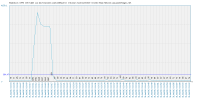
Same shape. Same length.
radhoo, Fri Feb 08 2013, 12:26PM
And here is the peak from January, 31:

Same shape. Same length.
Re: uRADMonitor – Online remote radiation monitoring station
Proud Mary, Fri Feb 08 2013, 12:43PM
I believe the rate of release of Rn from rocks, and its rise and fall as an Rn layer can be weather-related. I have no personal experience of this, but can't see how it could produce such a large and distinct effect.
If the tube voltage is set too high, right at the top end of the plateau slope, then even a very small increase of Va would trigger a storm of false counts.
Perhaps you could try pulling the anode voltage right down to the threshold level, so the tube will still be operating on the plateau if there is a sudden increase of anode voltage (providing it is not too large).
Re: uRADMonitor – Online remote radiation monitoring station
radhoo, Fri Feb 08 2013, 12:57PM
This was my first thought, and I already checked that the first time it happened. The tube voltage is monitored constantly, so what this means is that each time I take a reading, that is every minute, I get the CPM, but also the voltage on tube for that minute.
In both cases, the tube voltage has been in normal parameters (that is +-5V + 400V). The microcontroller unit carefully regulates the voltage on the tube. Here are the tube voltage measurements:
January 31:

The log shows: 402 / 401 / 400 / 399 V values during the abnormal radiation event
February 8:

The log shows: 400 / 399 V values during the abnormal radiation event
Also the duty cycle of the 400V inverter PWM is monitored. Also in normal parameters. And the voltage and duty cycle has been kept constant all the way since this monitor first became operational.
radhoo, Fri Feb 08 2013, 12:57PM
This was my first thought, and I already checked that the first time it happened. The tube voltage is monitored constantly, so what this means is that each time I take a reading, that is every minute, I get the CPM, but also the voltage on tube for that minute.
In both cases, the tube voltage has been in normal parameters (that is +-5V + 400V). The microcontroller unit carefully regulates the voltage on the tube. Here are the tube voltage measurements:
January 31:

The log shows: 402 / 401 / 400 / 399 V values during the abnormal radiation event
February 8:

The log shows: 400 / 399 V values during the abnormal radiation event
Also the duty cycle of the 400V inverter PWM is monitored. Also in normal parameters. And the voltage and duty cycle has been kept constant all the way since this monitor first became operational.
Re: uRADMonitor – Online remote radiation monitoring station
Proud Mary, Fri Feb 08 2013, 04:05PM
We see in the SBM-19 datasheet that the threshold is in the range 260V - 320V, and operating range is between 350V and 475V.
I suggest thoroughly cleaning the anode insulator with alcohol etc, baking it in a cool oven to boil off the solvent, and then painting it with dielectric varnish.
When this is done, re-set the power supply to 350V. This will give you the whole length of the plateau before random avalanches kick off in the tube, and also reduce the possibility of false triggering by micro surface discharges by reducing the voltage.
You must eliminate every possible error before deciding to accept this anomalous reading as true.
Re: uRADMonitor – Online remote radiation monitoring station
radhoo, Wed Feb 13 2013, 06:47PM
I cannot do that. Dropping the voltage would also decrease the number of registered pulses.
I just tried it with 350V, and the immediate change was a drop from an average of 80 cpm to about 65cpm. Since I already accumulated a few months of readings, changing the voltage at this point would break the data into two , incomparable sets.
Re: uRADMonitor – Online remote radiation monitoring station
Proud Mary, Wed Feb 13 2013, 07:40PM
Is the rate of increase along the plateau greater than 10% per hundred volts, which would suggest a bad tube?
Proud Mary, Wed Feb 13 2013, 07:40PM
Is the rate of increase along the plateau greater than 10% per hundred volts, which would suggest a bad tube?
Re: uRADMonitor – Online remote radiation monitoring station
radhoo, Thu Feb 14 2013, 09:54AM
Hm, Stella, I was hoping it didn't come to that. Here are the numbers:
For 350V the tube counts a background radiation dose of (average) 66 counts/minute. For 400V it is 80 counts/minute.
The difference of 14 units , that represents 17.5% out of the total of 80 cpm, or 21% out of the total of 66cpm, and this is for a voltage interval of the 50V only.
If I was more careful at the beginning of the project, I would have probably chosen the minimum voltage. Now changing the voltage would create a big discrepancy between the previous values (obtained at 400V) and the new values (at 350V).
Do you have any docs regarding tube's plateau variations related to tube damage?
Re: uRADMonitor – Online remote radiation monitoring station
Proud Mary, Thu Feb 14 2013, 11:03AM
"An investigation into the causes of short lifetimes of geiger-muller tubes used in aircraft oil gauging systems"

This very useful paper covers wide ground not covered elsewhere, and focuses particularly on halogen (Br) depletion as tubes age.
It also mentions low frequency spurious oscillation under depleted halogen conditions, which might possibly explain your tube's sudden burst of counts.
If your problem is oscillation, it might be possible to stop it by altering LCR in a way that does not affect count rate.
Here is another helpful paper looking at some of the fundamentals we need to think about right now: Test Procedure for Geiger-Mueller Radiation Detectors This paper proposes a 15% slope as the cut off between good and bad tubes: "In general, the value of the slope must be less than 15 % to consider that the detector is in good conditions." This seems to me to be a very large figure when you think of really good new GM tubes having plateau slopes of less than 3%.
This paper also offers some useful insights:
Proud Mary, Thu Feb 14 2013, 11:03AM
radhoo wrote ...
Do you have any docs regarding tube's plateau variations related to tube damage?
Do you have any docs regarding tube's plateau variations related to tube damage?
"An investigation into the causes of short lifetimes of geiger-muller tubes used in aircraft oil gauging systems"

This very useful paper covers wide ground not covered elsewhere, and focuses particularly on halogen (Br) depletion as tubes age.
It also mentions low frequency spurious oscillation under depleted halogen conditions, which might possibly explain your tube's sudden burst of counts.
If your problem is oscillation, it might be possible to stop it by altering LCR in a way that does not affect count rate.
Here is another helpful paper looking at some of the fundamentals we need to think about right now: Test Procedure for Geiger-Mueller Radiation Detectors
 This paper proposes a 15% slope as the cut off between good and bad tubes: "In general, the value of the slope must be less than 15 % to consider that the detector is in good conditions." This seems to me to be a very large figure when you think of really good new GM tubes having plateau slopes of less than 3%.
 This paper also offers some useful insights:

Re: uRADMonitor – Online remote radiation monitoring station
radhoo, Sat Feb 16 2013, 05:13PM
Thanks! Love the articles, great find!
Some bit of additional info, even if redundant, should help clarify things.
The 10M anode resistor is a quality component, mounted correctly without fingerprints, dust or humidity. As well pointed above, should this resistor malfunction in any way, one result could be avalanche discharges in the Geiger tube. This resistor has been checked recently and it meets the requirements.
Not related to the current discussion, there has been an issue that I would like to present at this point. Have a look at the circuit diagram:

Resistor R5 is used in a voltage divider , used by the microcontroller to continuously measure the voltage across the Geiger tube, using one of its ADC (analog to digital) ports. In just a few words, for 400V set on the tube, the voltage divider will retun 3.96V ( 400V x 47/(4700+47) ). The microcontroller is set to a relative voltage of 5V (Vref). The ADC port used to measure the voltage, has a resolution of 10bits, so for a maximum of 5V on PC3/ADC3, the software would read the max value of 2^10 = 1024. For 4V we would get the proportional value. By doing so, the measurement of the anode voltage is extremely precise.
Should the voltage on tube be lower than the preset threshold (400V), the duty factor of the inverter's PWM is increased, in small steps, until we reach the target voltage (in a given tolerance, initially set to 5V and now changed to 2V). If the voltage on the tube is too high, we do the opposite and decrease the duty factor. In a few words, this is a known regularization mechanism that works well, fact confirmed by the logs, showing several months of constant voltage tube values.
The issue I mentioned, is regarding R5. After some use, it "burned" and got interrupted. As a result, the voltage measurement could no longer be done, and the software saw the voltage on tube as being 0. As a result, the duty cycle began to rise, resulting in uncontrolled high voltage generation, way above the tube's safety limits. Luckily, this high voltage also resulted in microcontroller temporarily failure, and so the PWM generation stopped . This in turn, also stopped the dangerous voltage from being applied to the tube (except for the first few miliseconds).
Closing the parenthesis and moving further
In regards to the papers kindly indicated by Proud Mary, I have run a few measurements with the current setup, also in regards to the "Test Procedure for Geiger-Mueller Radiation Detectors" document. SBM-19's operation interval is 350-475V. For my particular tube, I got unsatisfactory readings for 350V, but good performance in the 375-450V interval, despite its age.
The measurements has been performed during several hours, to acquire sufficient data for computing average values.
Voltage on tube / CPM
349.33 / 65.88
375.64 / 78.62
399.65 / 79.98
424.71 / 80.18
449.51 / 79.68
Complete measurement details in attached PDF document: ]sbm_19.pdf[/file]
To test the tube's performance indicator as presented in "Test Procedure for Geiger-Mueller Radiation Detectors",
I set N1 = 78.62 , V1 = 375.64V , N2 = 79.68 and V2 = 449.51V
For P = 100 * ((N2 - N1)/(V2-V1)) * (100 / ( (N1+N2) / 2)) we get: 1.81060853 % .
LE: The device has been set to 375V, as compared to 400V used from October 2012 until now.
radhoo, Sat Feb 16 2013, 05:13PM
Thanks! Love the articles, great find!
Some bit of additional info, even if redundant, should help clarify things.
The 10M anode resistor is a quality component, mounted correctly without fingerprints, dust or humidity. As well pointed above, should this resistor malfunction in any way, one result could be avalanche discharges in the Geiger tube. This resistor has been checked recently and it meets the requirements.
Not related to the current discussion, there has been an issue that I would like to present at this point. Have a look at the circuit diagram:

Resistor R5 is used in a voltage divider , used by the microcontroller to continuously measure the voltage across the Geiger tube, using one of its ADC (analog to digital) ports. In just a few words, for 400V set on the tube, the voltage divider will retun 3.96V ( 400V x 47/(4700+47) ). The microcontroller is set to a relative voltage of 5V (Vref). The ADC port used to measure the voltage, has a resolution of 10bits, so for a maximum of 5V on PC3/ADC3, the software would read the max value of 2^10 = 1024. For 4V we would get the proportional value. By doing so, the measurement of the anode voltage is extremely precise.
Should the voltage on tube be lower than the preset threshold (400V), the duty factor of the inverter's PWM is increased, in small steps, until we reach the target voltage (in a given tolerance, initially set to 5V and now changed to 2V). If the voltage on the tube is too high, we do the opposite and decrease the duty factor. In a few words, this is a known regularization mechanism that works well, fact confirmed by the logs, showing several months of constant voltage tube values.
The issue I mentioned, is regarding R5. After some use, it "burned" and got interrupted. As a result, the voltage measurement could no longer be done, and the software saw the voltage on tube as being 0. As a result, the duty cycle began to rise, resulting in uncontrolled high voltage generation, way above the tube's safety limits. Luckily, this high voltage also resulted in microcontroller temporarily failure, and so the PWM generation stopped . This in turn, also stopped the dangerous voltage from being applied to the tube (except for the first few miliseconds).
Closing the parenthesis and moving further
In regards to the papers kindly indicated by Proud Mary, I have run a few measurements with the current setup, also in regards to the "Test Procedure for Geiger-Mueller Radiation Detectors" document. SBM-19's operation interval is 350-475V. For my particular tube, I got unsatisfactory readings for 350V, but good performance in the 375-450V interval, despite its age.
The measurements has been performed during several hours, to acquire sufficient data for computing average values.
Voltage on tube / CPM
349.33 / 65.88
375.64 / 78.62
399.65 / 79.98
424.71 / 80.18
449.51 / 79.68
Complete measurement details in attached PDF document: ]sbm_19.pdf[/file]
To test the tube's performance indicator as presented in "Test Procedure for Geiger-Mueller Radiation Detectors",
I set N1 = 78.62 , V1 = 375.64V , N2 = 79.68 and V2 = 449.51V
For P = 100 * ((N2 - N1)/(V2-V1)) * (100 / ( (N1+N2) / 2)) we get: 1.81060853 % .
LE: The device has been set to 375V, as compared to 400V used from October 2012 until now.
Re: uRADMonitor – Online remote radiation monitoring station
Proud Mary, Sat Feb 16 2013, 07:15PM
Did you set R7 at 10MΩ to reduce power draw and/or dissipation in the tube, extend tube life etc, or some other reason?
How does the circuit behave if you reduce R7/R8 to 4.7MΩ/110 kΩ , or even 3.9MΩ/82kΩ ? Reducing R7 will reduce dead time,
and create stronger, sharper, pulses with less possibility for instability.
Re: uRADMonitor – Online remote radiation monitoring station
radhoo, Sun Feb 17 2013, 05:33PM
I set it to a maximum to preserve tube's life (considering the purpose of this device) , also according to Centronic's "Geiger Müller Tubes" document recommendations.
radhoo, Sun Feb 17 2013, 05:33PM
I set it to a maximum to preserve tube's life (considering the purpose of this device) , also according to Centronic's "Geiger Müller Tubes" document recommendations.
Re: uRADMonitor – Online remote radiation monitoring station
radhoo, Sat Nov 02 2013, 09:45PM
One year after the original construction was completed, I finally had the time for a major upgrade. The test board PCB was dropped in favor of a brand new PCB, nicely done via the toner transfer method:
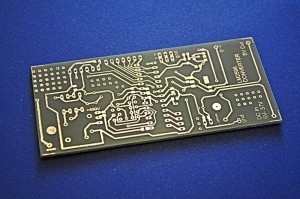
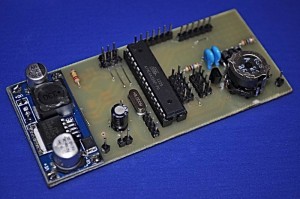
Much better than the previous, don't you think? :)
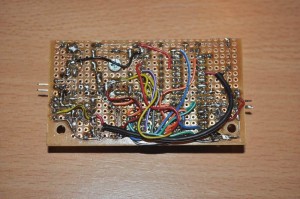
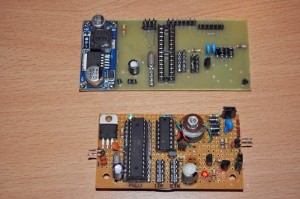
The ferrite transformer was reused, as it demonstrated very good efficiency. After all, rewinding 600 secondary turns is not an easy task. But I almost had to do that, because for some reason I had issues with the inverter. It turned out the driving transistor was misplaced due to an error in the eagle symbol used (it was mirrored!) . But that was an easy fix once I located where the problem was.
So I added 3 additional sensors for detecting rain and for air quality ( MQ-9B for combustible gases and Sharp GP2Y1010 for counting the dust particles). The MQ9 was producing a lot of heat so I had to move it some distance away from my temperature sensors:
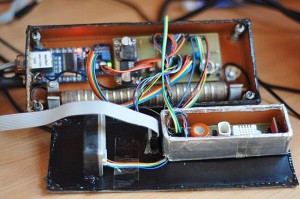
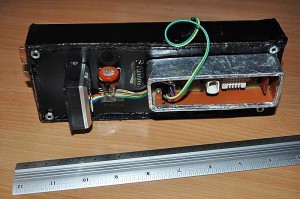
I also had to do some considerable work at the software side, first to support all the new sensors and the new PCB (mainly because of pin changes, new 8MHz crystal instead of the older 16MHz, new VCC of only 3.3V etc), but also on the server side to fit the mySQL database for the new readings and to draw the additional charts. These can be see here, as real time charts:
Rain detection:

MQ9 Combustible gases sensor:

Dust sensor:

This is my way of saying "happy birthday" to this project :)
radhoo, Sat Nov 02 2013, 09:45PM
One year after the original construction was completed, I finally had the time for a major upgrade. The test board PCB was dropped in favor of a brand new PCB, nicely done via the toner transfer method:


Much better than the previous, don't you think? :)


The ferrite transformer was reused, as it demonstrated very good efficiency. After all, rewinding 600 secondary turns is not an easy task. But I almost had to do that, because for some reason I had issues with the inverter. It turned out the driving transistor was misplaced due to an error in the eagle symbol used (it was mirrored!) . But that was an easy fix once I located where the problem was.
So I added 3 additional sensors for detecting rain and for air quality ( MQ-9B for combustible gases and Sharp GP2Y1010 for counting the dust particles). The MQ9 was producing a lot of heat so I had to move it some distance away from my temperature sensors:


I also had to do some considerable work at the software side, first to support all the new sensors and the new PCB (mainly because of pin changes, new 8MHz crystal instead of the older 16MHz, new VCC of only 3.3V etc), but also on the server side to fit the mySQL database for the new readings and to draw the additional charts. These can be see here, as real time charts:
Rain detection:

MQ9 Combustible gases sensor:

Dust sensor:

This is my way of saying "happy birthday" to this project :)
Re: uRADMonitor – Online remote radiation monitoring station
radhoo, Sun Dec 01 2013, 08:20PM
After a few days of inactivity, I was finally able to investigate a few sever stability problems with the new circuit presented in the last update.
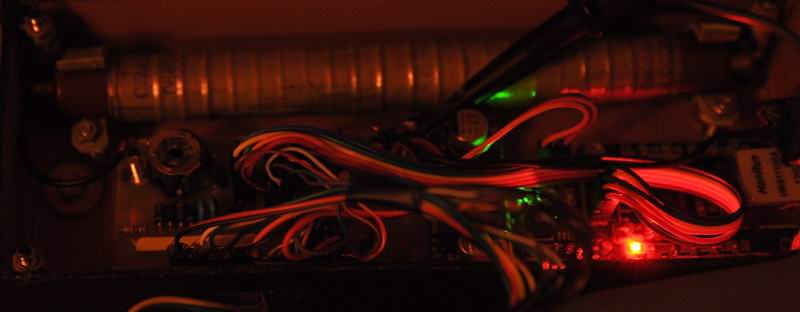
I was able to locate the problem, and I fixed it, but besides that I improved the software and finalized the part for the last three sensors added, rain, dust and cobustible gases. So now the station is back online, and the real time data is available here:
Today it December the first, Romania's national day. We had a beautiful sunny day, seen the military parade, a few concerts and the winter fair, that is now open here.

radhoo, Sun Dec 01 2013, 08:20PM
After a few days of inactivity, I was finally able to investigate a few sever stability problems with the new circuit presented in the last update.

I was able to locate the problem, and I fixed it, but besides that I improved the software and finalized the part for the last three sensors added, rain, dust and cobustible gases. So now the station is back online, and the real time data is available here:

Today it December the first, Romania's national day. We had a beautiful sunny day, seen the military parade, a few concerts and the winter fair, that is now open here.

Print this page